Power Outages by State: How Long, How Often and Which States Are Getting Worse, 2015 to 2025
- Data
- U.S. EIA Electric Power Annual 2025, Tables 11.1, 11.3 and 11.4 (from Form EIA-861 reliability data); U.S. DOE Form DOE-417 annual summaries
- Period
- 2015 to 2025 (EIA); 2013 to 2025 (DOE-417)
- Release used
- 2026-10-21
- Next release
- EIA Electric Power Annual: October 2027; EIA-861 early release: August 2027
- Geography
- 50 states and the District of Columbia
- Sources
- 20 (14 official)
Power outages by state, 2025: the average US electricity customer went 262.6 minutes (4.4 hours) without power across 1.338 interruptions, EIA data show. West Virginia was longest at 16.9 hours and DC shortest at 0.8. Excluding major events, outage time worsened in 17 states and improved in 16 since 2015 to 2017.
Power outages by state: West Virginia customers averaged 16.9 hours without power in 2025
In 2025 the average US electricity customer was without power for 262.6 minutes, or 4.4 hours. The five longest (West Virginia, Michigan, Nebraska, Alaska, Mississippi) were all at or above 501.2 minutes; the five shortest, led by the District of Columbia, were all at or below 117.5 minutes.
West Virginia customers averaged 1,013.2 minutes without power in 2025 (16.9 hours), the longest of the 50 states and DC, according to EIA Electric Power Annual 2025, Table 11.3. Michigan was second at 671.5 minutes (11.2 hours), followed by Nebraska (547.3), Alaska (540.9) and Mississippi (501.2).
The District of Columbia had the shortest outage time in 2025 at 50.3 minutes, followed by Arizona (69.9), Florida (70.5), Delaware (102.5) and Utah (117.5). The US figure of 262.6 minutes was 57.0% below the 611.3 minutes of 2024 and the lowest since 2016 (EIA Table 11.1).
SAIDI including major event days, any reporting method
Source: U.S. EIA, Electric Power Annual 2025, Table 11.3 (released October 21, 2026)
SAIDI (System Average Interruption Duration Index): Total minutes of sustained interruptions per customer in a year, averaged over all customers a utility serves. EIA weights each utility's value by its customer count to build state and US figures. A customer is a metered account, not a person.
SAIDI including major event days
Source: U.S. EIA, Electric Power Annual 2025, Table 11.3
A single year can mislead, because one hurricane season can dominate a state's total. Over the 11 years from 2015 to 2025, Louisiana had the highest average at 1,110.3 minutes a year (18.5 hours), followed by Maine (1,073.1), West Virginia (854.4), South Carolina (658.2) and Mississippi (628.1), based on EIA Table 11.4. The District of Columbia had the lowest 11-year average, 68.7 minutes.
Show all 52 rows
| Rank | State | SAIDI with major events (min) | Hours without power | SAIDI without major events (min) | Major event share (%) | SAIFI with major events | CAIDI with major events (min) | Customers covered (%) |
|---|---|---|---|---|---|---|---|---|
| 1 | West Virginia | 1,013.2 | 16.9 | 498.1 | 50.8 | 3.082 | 328.8 | 97.6 |
| 2 | Michigan | 671.5 | 11.2 | 160.3 | 76.1 | 1.424 | 471.6 | 97.6 |
| 3 | Nebraska | 547.3 | 9.1 | 116.3 | 78.8 | 1.319 | 414.9 | 74.1 |
| 4 | Alaska | 540.9 | 9.0 | 242.7 | 55.1 | 3.203 | 168.9 | 84.2 |
| 5 | Mississippi | 501.2 | 8.4 | 305.5 | 39.0 | 2.594 | 193.2 | 77.6 |
| 6 | Arkansas | 464.8 | 7.7 | 206.2 | 55.6 | 2.131 | 218.1 | 89.4 |
| 7 | Pennsylvania | 458.1 | 7.6 | 132.8 | 71.0 | 1.408 | 325.4 | 94.5 |
| 8 | Missouri | 457.2 | 7.6 | 116.3 | 74.6 | 1.365 | 335.1 | 86.6 |
| 9 | Virginia | 445.7 | 7.4 | 177.0 | 60.3 | 1.951 | 228.5 | 97.0 |
| 10 | Kentucky | 408.2 | 6.8 | 173.1 | 57.6 | 1.917 | 212.9 | 96.6 |
| 11 | Indiana | 374.0 | 6.2 | 123.2 | 67.1 | 1.390 | 269.1 | 93.0 |
| 12 | Washington | 372.5 | 6.2 | 144.3 | 61.3 | 1.413 | 263.5 | 95.2 |
| 13 | Alabama | 371.6 | 6.2 | 114.6 | 69.2 | 2.011 | 184.7 | 72.7 |
| 14 | Maine | 363.4 | 6.1 | 191.7 | 47.2 | 2.240 | 162.2 | 100.2 |
| 15 | California | 344.6 | 5.7 | 135.0 | 60.8 | 1.282 | 268.9 | 98.5 |
| 16 | Idaho | 306.2 | 5.1 | 149.0 | 51.3 | 1.158 | 264.3 | 95.2 |
| 17 | Oregon | 297.4 | 5.0 | 103.5 | 65.2 | 1.123 | 264.7 | 92.8 |
| 18 | Montana | 288.1 | 4.8 | 137.2 | 52.4 | 1.358 | 212.2 | 73.4 |
| 19 | Oklahoma | 285.5 | 4.8 | 144.8 | 49.3 | 1.816 | 157.2 | 89.8 |
| 20 | Hawaii | 282.1 | 4.7 | 187.5 | 33.5 | 2.023 | 139.4 | 99.7 |
| 21 | Colorado | 269.9 | 4.5 | 116.7 | 56.8 | 1.281 | 210.6 | 94.0 |
| 22 | Louisiana | 269.5 | 4.5 | 218.9 | 18.8 | 2.324 | 116.0 | 93.6 |
| 23 | Georgia | 269.3 | 4.5 | 147.0 | 45.4 | 1.854 | 145.2 | 90.0 |
| 24 | South Dakota | 268.5 | 4.5 | 61.4 | 77.1 | 1.335 | 201.2 | 76.5 |
| 25 | Vermont | 262.9 | 4.4 | 184.6 | 29.8 | 1.697 | 154.9 | 89.8 |
| 26 | New Hampshire | 231.3 | 3.9 | 135.1 | 41.6 | 1.447 | 159.9 | 99.3 |
| 27 | Wisconsin | 230.0 | 3.8 | 84.2 | 63.4 | 0.940 | 244.7 | 92.4 |
| 28 | Tennessee | 229.0 | 3.8 | 150.6 | 34.2 | 1.643 | 139.3 | 75.3 |
| 29 | Wyoming | 224.2 | 3.7 | 104.7 | 53.3 | 1.514 | 148.0 | 76.4 |
| 30 | Texas | 223.5 | 3.7 | 128.7 | 42.4 | 1.704 | 131.2 | 99.2 |
| 31 | Ohio | 205.4 | 3.4 | 130.0 | 36.7 | 1.275 | 161.1 | 96.8 |
| 32 | North Dakota | 203.5 | 3.4 | 72.8 | 64.2 | 1.142 | 178.2 | 89.1 |
| 33 | Kansas | 196.1 | 3.3 | 96.9 | 50.6 | 1.319 | 148.7 | 82.4 |
| 34 | North Carolina | 191.7 | 3.2 | 140.7 | 26.6 | 1.375 | 139.4 | 95.6 |
| 35 | Connecticut | 183.9 | 3.1 | 76.7 | 58.3 | 0.928 | 198.2 | 100.9 |
| 36 | Rhode Island | 183.0 | 3.0 | 60.1 | 67.2 | 0.960 | 190.6 | 96.9 |
| 37 | Minnesota | 182.4 | 3.0 | 93.7 | 48.6 | 1.175 | 155.2 | 89.1 |
| 38 | Maryland | 178.3 | 3.0 | 78.9 | 55.7 | 0.956 | 186.5 | 98.5 |
| 39 | New Mexico | 172.0 | 2.9 | 149.3 | 13.2 | 1.294 | 133.0 | 90.8 |
| 40 | New Jersey | 154.9 | 2.6 | 95.8 | 38.2 | 1.123 | 137.9 | 100.9 |
| 41 | Iowa | 151.8 | 2.5 | 78.4 | 48.4 | 1.032 | 147.0 | 85.5 |
| 42 | South Carolina | 151.1 | 2.5 | 103.6 | 31.4 | 1.251 | 120.7 | 98.7 |
| 43 | Illinois | 144.5 | 2.4 | 62.1 | 57.0 | 0.871 | 165.9 | 97.0 |
| 44 | Nevada | 127.8 | 2.1 | 100.7 | 21.2 | 1.125 | 113.6 | 103.1 |
| 45 | New York | 122.0 | 2.0 | 73.8 | 39.5 | 0.796 | 153.3 | 99.3 |
| 46 | Massachusetts | 121.0 | 2.0 | 75.3 | 37.8 | 0.906 | 133.6 | 93.3 |
| 47 | Utah | 117.5 | 2.0 | 99.1 | 15.7 | 0.883 | 133.0 | 89.1 |
| 48 | Delaware | 102.5 | 1.7 | 73.7 | 28.1 | 0.929 | 110.2 | 88.9 |
| 49 | Florida | 70.5 | 1.2 | 63.4 | 10.1 | 0.858 | 82.2 | 100.0 |
| 50 | Arizona | 69.9 | 1.2 | 62.6 | 10.4 | 0.892 | 78.3 | 96.3 |
| 51 | District of Columbia | 50.3 | 0.8 | 33.9 | 32.6 | 0.324 | 155.2 | 98.7 |
| United States | 262.6 | 4.4 | 120.8 | 54.0 | 1.338 | 196.3 | 94.7 |
Ranked by SAIDI including major event days. Hours = SAIDI / 60. Major event share = (SAIDI with minus SAIDI without) / SAIDI with. Customers covered = share of customers whose utilities reported.
Source: [1] U.S. Energy Information Administration
How long power outages last in the US: 196.3 minutes per interruption in 2025
Once the power went out in 2025, the average US customer waited 196.3 minutes (3.3 hours) for it to come back, or 114.7 minutes (1.9 hours) outside major events. Storm years stretch restoration time; on ordinary days it has stayed between 108.1 and 120.8 minutes since 2015.
How long power outages last depends mostly on whether a storm is involved. In 2025 the average interruption for a US electricity customer lasted 196.3 minutes (3.3 hours) including major events and 114.7 minutes (1.9 hours) excluding them (EIA Table 11.1). In 2024, the year of Hurricanes Beryl, Helene and Milton, the average interruption lasted 401.9 minutes (6.7 hours).
CAIDI (Customer Average Interruption Duration Index): SAIDI divided by SAIFI: the average number of minutes it takes to restore power once a sustained interruption starts. EIA reports it with and without major event days.
From 2015 to 2025, US restoration time including major events ranged from 164.5 minutes (2015) to 401.9 minutes (2024). Without major events it stayed between 108.1 and 120.8 minutes in every year, so an ordinary-day outage for the average customer lasts close to 2 hours (EIA Electric Power Annual 2025, Table 11.1).
By state, Michigan customers waited longest per interruption in 2025: 471.6 minutes (7.9 hours), followed by Nebraska (414.9), Missouri (335.1), West Virginia (328.8) and Pennsylvania (325.4). Arizona (78.3), Florida (82.2), Delaware (110.2), Nevada (113.6) and Louisiana (116.0) had the shortest (EIA Table 11.3). Michigan ranked second on total outage time while ranking 18th on frequency (1.424 interruptions), because each interruption lasted long.
Power outages in the US, counted per customer: the average customer had 1.338 sustained interruptions in 2025 and was without power for 262.6 minutes (4.4 hours) in total. Applied to the 153.9 million customers of utilities that reported reliability data, that is about 206 million customer interruptions in 2025, 162 million of them outside major events, against about 231 million in 2024 (ECW estimate from EIA data). A customer interruption counts each time one metered account loses power, so a single storm outage can add thousands.
Major events caused 67.5% of US outage minutes from 2015 to 2025
Outage minutes on ordinary days barely move from year to year; storm days drive the swings. In 2024, major event days produced 79.4% of US outage minutes; in the quieter 2025, 54.0%.
Without major event days, the average US customer lost 120.8 minutes of power in 2025 (2.0 hours) and 126.0 in 2024. Including them, the totals were 262.6 and 611.3 minutes (EIA Table 11.1). The difference is the time attributed to storms and other events outside normal operating conditions.
Average minutes without power per customer per year
Source: U.S. EIA, Electric Power Annual 2025, Table 11.1 (any method)
Major event day (MED): Under IEEE Standard 1366, a day on which a utility's daily SAIDI exceeds a threshold (Tmed) calculated from its previous five years of daily data. Utilities that do not use IEEE methods define major events themselves, according to EIA's table notes.
Across 2015 to 2025, major event days caused more than half of outage minutes in 36 of the 51 jurisdictions. The highest shares were in Florida (87.4%), Connecticut (84.0%), South Carolina (82.3%) and Louisiana (81.2%). The lowest were in the District of Columbia (21.4%), New Mexico (26.0%) and Wyoming (30.3%).
Show all 52 rows
| State | Rank by 2015-2025 avg SAIDI with major events | Avg SAIDI with major events 2015-2025 (min) | Avg SAIDI without major events 2015-2025 (min) | Major event share 2015-2025 (%) | Major event share 2024 (%) | Major event share 2025 (%) |
|---|---|---|---|---|---|---|
| Florida | 8 | 574.9 | 72.4 | 87.4 | 95.0 | 10.1 |
| Connecticut | 15 | 446.2 | 71.5 | 84.0 | 52.4 | 58.3 |
| South Carolina | 4 | 658.2 | 116.7 | 82.3 | 96.2 | 31.4 |
| Louisiana | 1 | 1,110.3 | 208.3 | 81.2 | 71.7 | 18.8 |
| Rhode Island | 23 | 321.9 | 63.6 | 80.2 | 41.7 | 67.2 |
| Maine | 2 | 1,073.1 | 235.1 | 78.1 | 84.3 | 47.2 |
| Oklahoma | 6 | 609.1 | 142.0 | 76.7 | 55.9 | 49.3 |
| North Carolina | 9 | 573.9 | 143.9 | 74.9 | 90.2 | 26.6 |
| New Hampshire | 11 | 491.4 | 131.0 | 73.3 | 85.7 | 41.6 |
| Texas | 12 | 475.3 | 132.6 | 72.1 | 89.8 | 42.4 |
| Oregon | 18 | 383.8 | 108.8 | 71.7 | 77.9 | 65.2 |
| Nebraska | 35 | 233.6 | 68.1 | 70.8 | 88.5 | 78.8 |
| Georgia | 14 | 455.5 | 137.2 | 69.9 | 82.7 | 45.4 |
| Michigan | 7 | 585.5 | 176.6 | 69.8 | 66.0 | 76.1 |
| Alabama | 17 | 392.5 | 121.4 | 69.1 | 57.8 | 69.2 |
| Iowa | 29 | 271.3 | 85.1 | 68.6 | 46.1 | 48.4 |
| New Jersey | 31 | 261.1 | 84.6 | 67.6 | 42.8 | 38.2 |
| Massachusetts | 26 | 278.0 | 95.3 | 65.7 | 25.4 | 37.8 |
| Kentucky | 16 | 409.1 | 142.6 | 65.1 | 76.4 | 57.6 |
| Washington | 20 | 367.6 | 130.5 | 64.5 | 74.6 | 61.3 |
| Mississippi | 5 | 628.1 | 230.1 | 63.4 | 53.0 | 39.0 |
| New York | 38 | 201.1 | 76.5 | 61.9 | 67.3 | 39.5 |
| Wisconsin | 37 | 209.2 | 83.7 | 60.0 | 65.7 | 63.4 |
| Missouri | 32 | 245.5 | 100.4 | 59.1 | 52.7 | 74.6 |
| Tennessee | 19 | 369.1 | 154.1 | 58.2 | 42.7 | 34.2 |
| Illinois | 47 | 158.3 | 67.9 | 57.1 | 62.1 | 57.0 |
| Pennsylvania | 27 | 275.1 | 118.5 | 56.9 | 61.0 | 71.0 |
| Vermont | 10 | 546.8 | 238.5 | 56.4 | 60.5 | 29.8 |
| Indiana | 24 | 294.8 | 128.8 | 56.3 | 61.1 | 67.1 |
| California | 28 | 273.9 | 121.3 | 55.7 | 43.4 | 60.8 |
| Arkansas | 13 | 471.4 | 212.1 | 55.0 | 61.8 | 55.6 |
| Kansas | 33 | 242.4 | 112.3 | 53.7 | 63.7 | 50.6 |
| Ohio | 25 | 287.7 | 137.3 | 52.3 | 73.9 | 36.7 |
| Virginia | 22 | 352.0 | 167.8 | 52.3 | 60.2 | 60.3 |
| Minnesota | 41 | 174.0 | 83.4 | 52.1 | 58.0 | 48.6 |
| South Dakota | 44 | 166.7 | 81.7 | 51.0 | 26.7 | 77.1 |
| Maryland | 45 | 164.4 | 86.5 | 47.4 | 36.4 | 55.7 |
| North Dakota | 46 | 162.0 | 87.2 | 46.2 | 15.0 | 64.2 |
| Colorado | 43 | 170.8 | 92.6 | 45.8 | 53.4 | 56.8 |
| West Virginia | 3 | 854.4 | 469.7 | 45.0 | 58.3 | 50.8 |
| Hawaii | 34 | 242.2 | 134.4 | 44.5 | 29.6 | 33.5 |
| Delaware | 48 | 133.9 | 78.6 | 41.3 | 43.2 | 28.1 |
| Montana | 36 | 231.0 | 138.4 | 40.1 | 55.4 | 52.4 |
| Alaska | 21 | 366.5 | 219.8 | 40.0 | 41.2 | 55.1 |
| Nevada | 49 | 120.6 | 74.4 | 38.3 | 59.8 | 21.2 |
| Utah | 40 | 178.8 | 112.4 | 37.2 | 10.9 | 15.7 |
| Idaho | 30 | 270.4 | 173.9 | 35.7 | 25.3 | 51.3 |
| Arizona | 50 | 95.5 | 65.9 | 31.0 | 17.7 | 10.4 |
| Wyoming | 39 | 183.2 | 127.7 | 30.3 | 20.8 | 53.3 |
| New Mexico | 42 | 170.9 | 126.5 | 26.0 | 43.9 | 13.2 |
| District of Columbia | 51 | 68.7 | 54.0 | 21.4 | 19.0 | 32.6 |
| United States | 367.4 | 119.2 | 67.5 | 79.4 | 54.0 |
Sorted by the 2015 to 2025 major event share. Averages are simple means of 11 annual EIA values.
Source: [1][2] U.S. Energy Information Administration; U.S. Energy Information Administration
West Virginia is the clearest case of a state with long outages on ordinary days: 498.1 minutes without major events in 2025, the most of any state, and a major event share of only 50.8%. Mississippi (305.5 minutes) and Alaska (242.7) follow.
How often the power goes out: 1.338 interruptions per US customer in 2025
Frequency (SAIFI) and duration (SAIDI) rank states differently. Alaska had the most interruptions per customer in 2025 (3.203); the District of Columbia the fewest (0.324).
The average US customer had 1.338 sustained interruptions in 2025, down from 1.521 in 2024, and 1.053 excluding major event days (EIA Table 11.1). Alaska (3.203), West Virginia (3.082), Mississippi (2.594), Louisiana (2.324) and Maine (2.240) had the most (EIA Electric Power Annual 2025, Table 11.3).
SAIFI including major event days
Source: U.S. EIA, Electric Power Annual 2025, Table 11.3
SAIFI (System Average Interruption Frequency Index): The average number of sustained interruptions per customer per year, weighted by customers in the same way as SAIDI.
Show all 52 rows
| Rank | State | SAIFI with major events 2025 | SAIFI without major events 2025 | SAIFI with major events 2024 | SAIFI without major events 2024 |
|---|---|---|---|---|---|
| 1 | Alaska | 3.203 | 2.204 | 2.591 | 1.862 |
| 2 | West Virginia | 3.082 | 2.463 | 2.832 | 2.287 |
| 3 | Mississippi | 2.594 | 2.032 | 2.555 | 1.963 |
| 4 | Louisiana | 2.324 | 2.020 | 2.722 | 1.751 |
| 5 | Maine | 2.240 | 1.834 | 3.636 | 2.139 |
| 6 | Arkansas | 2.131 | 1.581 | 2.128 | 1.587 |
| 7 | Hawaii | 2.023 | 1.636 | 2.616 | 2.180 |
| 8 | Alabama | 2.011 | 0.986 | 1.870 | 1.037 |
| 9 | Virginia | 1.951 | 1.440 | 1.627 | 1.342 |
| 10 | Kentucky | 1.917 | 1.442 | 1.955 | 1.320 |
| 11 | Georgia | 1.854 | 1.453 | 2.122 | 1.264 |
| 12 | Oklahoma | 1.816 | 1.277 | 1.731 | 1.147 |
| 13 | Texas | 1.704 | 1.287 | 2.114 | 1.218 |
| 14 | Vermont | 1.697 | 1.563 | 2.516 | 1.661 |
| 15 | Tennessee | 1.643 | 1.539 | 2.000 | 1.764 |
| 16 | Wyoming | 1.514 | 0.867 | 0.999 | 0.869 |
| 17 | New Hampshire | 1.447 | 1.019 | 2.021 | 0.985 |
| 18 | Michigan | 1.424 | 1.036 | 1.356 | 0.986 |
| 19 | Washington | 1.413 | 1.024 | 1.752 | 1.087 |
| 20 | Pennsylvania | 1.408 | 1.018 | 1.353 | 0.971 |
| 21 | Indiana | 1.390 | 0.984 | 1.283 | 0.997 |
| 22 | North Carolina | 1.375 | 1.196 | 1.812 | 1.172 |
| 23 | Missouri | 1.365 | 0.947 | 1.189 | 0.919 |
| 24 | Montana | 1.358 | 1.196 | 1.621 | 1.161 |
| 25 | South Dakota | 1.335 | 0.757 | 0.815 | 0.720 |
| 26 | Kansas | 1.319 | 0.959 | 1.506 | 1.003 |
| 27 | Nebraska | 1.319 | 0.604 | 1.232 | 0.595 |
| 28 | New Mexico | 1.294 | 1.154 | 1.321 | 1.109 |
| 29 | California | 1.282 | 1.054 | 1.345 | 1.154 |
| 30 | Colorado | 1.281 | 1.082 | 1.409 | 1.142 |
| 31 | Ohio | 1.275 | 1.082 | 1.298 | 0.999 |
| 32 | South Carolina | 1.251 | 1.063 | 2.365 | 1.207 |
| 33 | Minnesota | 1.175 | 0.945 | 1.250 | 0.901 |
| 34 | Idaho | 1.158 | 0.974 | 1.314 | 1.136 |
| 35 | North Dakota | 1.142 | 0.818 | 0.915 | 0.857 |
| 36 | Nevada | 1.125 | 1.007 | 1.108 | 0.658 |
| 37 | New Jersey | 1.123 | 0.971 | 1.119 | 0.948 |
| 38 | Oregon | 1.123 | 0.707 | 1.346 | 0.857 |
| 39 | Iowa | 1.032 | 0.775 | 1.150 | 0.887 |
| 40 | Rhode Island | 0.960 | 0.730 | 0.896 | 0.761 |
| 41 | Maryland | 0.956 | 0.733 | 0.817 | 0.686 |
| 42 | Wisconsin | 0.940 | 0.677 | 1.020 | 0.729 |
| 43 | Delaware | 0.929 | 0.779 | 0.843 | 0.717 |
| 44 | Connecticut | 0.928 | 0.653 | 0.876 | 0.644 |
| 45 | Massachusetts | 0.906 | 0.744 | 0.843 | 0.743 |
| 46 | Arizona | 0.892 | 0.836 | 0.988 | 0.898 |
| 47 | Utah | 0.883 | 0.835 | 1.030 | 0.966 |
| 48 | Illinois | 0.871 | 0.704 | 0.852 | 0.644 |
| 49 | Florida | 0.858 | 0.777 | 1.770 | 0.762 |
| 50 | New York | 0.796 | 0.638 | 0.910 | 0.611 |
| 51 | District of Columbia | 0.324 | 0.309 | 0.271 | 0.246 |
| United States | 1.338 | 1.053 | 1.521 | 1.043 |
SAIFI counts non-momentary interruptions per customer; momentary blinks are excluded.
Source: [1] U.S. Energy Information Administration
Outage time on ordinary days rose in 17 states and fell in 16 since 2015
Comparing 2015 to 2017 with 2023 to 2025, US outage minutes including major events rose 31.1%, but minutes without major events rose only 6.0%. Nationally, almost all of the growth came from major event days.
Using three-year averages to damp single-storm years, US SAIDI including major events went from 309.1 minutes (2015 to 2017) to 405.3 minutes (2023 to 2025), and rose in 37 of 51 jurisdictions (EIA Table 11.4). Without major events, the US average moved from 114.8 to 121.7 minutes.
On the ordinary-day measure, 17 states got worse by more than 10%, 16 improved by more than 10%, and 18 changed less than that. The largest rises were in Hawaii (+68.8%), Alaska (+62.3%) and California (+52.7%). The largest falls were in the District of Columbia (-67.2%), Wyoming (-38.9%) and Idaho (-35.0%).
SAIDI without major event days, three-year averages; 10 largest rises and 10 largest falls
Source: ECW Data Desk calculation from U.S. EIA Electric Power Annual 2025, Table 11.4
Single-year comparisons tell the same story. US SAIDI without major events was 113.1 minutes in 2015 and 120.8 in 2025, a rise of 6.8%. US SAIFI without major events moved 0.7% over the same years, from 1.046 to 1.053.
Show all 52 rows
| State | SAIDI with major events 2015-2017 avg (min) | SAIDI with major events 2023-2025 avg (min) | Change with (%) | SAIDI without major events 2015-2017 avg (min) | SAIDI without major events 2023-2025 avg (min) | Change without (%) | Direction (without major events) |
|---|---|---|---|---|---|---|---|
| Hawaii | 215.7 | 364.8 | 69.1 | 110.9 | 187.2 | 68.8 | worse |
| Alaska | 316.9 | 414.3 | 30.7 | 156.3 | 253.6 | 62.3 | worse |
| California | 156.3 | 323.6 | 107.0 | 97.2 | 148.4 | 52.7 | worse |
| Nebraska | 108.0 | 420.5 | 289.4 | 57.9 | 82.2 | 42.0 | worse |
| Mississippi | 384.9 | 623.5 | 62.0 | 198.7 | 274.9 | 38.3 | worse |
| New Mexico | 133.1 | 206.6 | 55.2 | 106.3 | 146.0 | 37.3 | worse |
| Georgia | 572.4 | 615.9 | 7.6 | 121.9 | 165.4 | 35.7 | worse |
| Colorado | 168.0 | 208.1 | 23.9 | 81.5 | 108.0 | 32.5 | worse |
| New Jersey | 161.2 | 145.8 | -9.6 | 73.9 | 94.7 | 28.1 | worse |
| Pennsylvania | 153.2 | 349.0 | 127.8 | 103.0 | 127.7 | 24.0 | worse |
| Washington | 380.6 | 382.6 | 0.5 | 116.7 | 144.5 | 23.8 | worse |
| Tennessee | 310.8 | 455.2 | 46.5 | 137.2 | 165.4 | 20.6 | worse |
| Missouri | 227.5 | 351.1 | 54.3 | 92.7 | 109.7 | 18.3 | worse |
| Kentucky | 210.0 | 641.6 | 205.5 | 132.4 | 156.6 | 18.3 | worse |
| Nevada | 105.7 | 141.8 | 34.2 | 72.3 | 81.9 | 13.3 | worse |
| Virginia | 211.4 | 361.7 | 71.1 | 151.7 | 167.6 | 10.5 | worse |
| Arizona | 89.3 | 88.1 | -1.3 | 61.6 | 68.0 | 10.4 | worse |
| Louisiana | 381.5 | 527.1 | 38.2 | 188.9 | 206.6 | 9.4 | little change |
| Oregon | 249.5 | 338.4 | 35.6 | 104.6 | 114.1 | 9.1 | little change |
| Wisconsin | 148.3 | 226.4 | 52.7 | 76.1 | 82.6 | 8.5 | little change |
| Minnesota | 195.1 | 176.1 | -9.7 | 79.7 | 86.4 | 8.4 | little change |
| Arkansas | 366.5 | 628.4 | 71.5 | 201.1 | 207.5 | 3.2 | little change |
| North Carolina | 433.1 | 628.2 | 45.0 | 141.0 | 145.2 | 3.0 | little change |
| Maine | 1,080.5 | 1,325.0 | 22.6 | 233.9 | 237.7 | 1.6 | little change |
| West Virginia | 749.6 | 976.7 | 30.3 | 449.6 | 456.6 | 1.6 | little change |
| Alabama | 233.9 | 315.1 | 34.7 | 118.9 | 117.5 | -1.2 | little change |
| South Carolina | 747.4 | 1,151.6 | 54.1 | 119.5 | 115.8 | -3.1 | little change |
| Connecticut | 189.5 | 167.4 | -11.7 | 76.8 | 73.4 | -4.4 | little change |
| Texas | 320.0 | 663.4 | 107.3 | 134.1 | 127.6 | -4.8 | little change |
| Montana | 221.3 | 252.8 | 14.2 | 144.5 | 137.0 | -5.2 | little change |
| Ohio | 198.2 | 360.7 | 82.0 | 137.8 | 130.1 | -5.6 | little change |
| Vermont | 479.2 | 568.0 | 18.5 | 241.7 | 227.0 | -6.1 | little change |
| New York | 140.3 | 154.0 | 9.8 | 76.7 | 71.9 | -6.3 | little change |
| Indiana | 236.3 | 380.6 | 61.1 | 126.2 | 118.3 | -6.3 | little change |
| New Hampshire | 484.9 | 599.9 | 23.7 | 143.5 | 130.7 | -8.9 | little change |
| Rhode Island | 413.0 | 130.6 | -68.4 | 64.2 | 57.7 | -10.1 | better |
| North Dakota | 107.9 | 170.4 | 57.9 | 91.6 | 82.3 | -10.2 | better |
| Oklahoma | 479.7 | 484.3 | 1.0 | 152.3 | 134.6 | -11.6 | better |
| Michigan | 470.0 | 745.2 | 58.6 | 183.8 | 161.0 | -12.4 | better |
| Iowa | 111.2 | 141.1 | 26.9 | 90.9 | 79.5 | -12.5 | better |
| Utah | 176.2 | 121.5 | -31.0 | 125.2 | 105.2 | -16.0 | better |
| Florida | 980.6 | 517.4 | -47.2 | 79.4 | 66.3 | -16.5 | better |
| Massachusetts | 170.5 | 160.8 | -5.7 | 93.6 | 77.9 | -16.8 | better |
| Kansas | 293.3 | 254.9 | -13.1 | 131.2 | 100.7 | -23.2 | better |
| Maryland | 120.4 | 154.2 | 28.1 | 100.0 | 73.6 | -26.4 | better |
| Illinois | 141.3 | 169.9 | 20.2 | 81.0 | 59.2 | -26.9 | better |
| South Dakota | 162.0 | 143.4 | -11.5 | 90.5 | 62.2 | -31.3 | better |
| Delaware | 164.3 | 108.9 | -33.7 | 100.4 | 66.7 | -33.6 | better |
| Idaho | 325.4 | 225.5 | -30.7 | 227.0 | 147.5 | -35.0 | better |
| Wyoming | 198.2 | 163.0 | -17.8 | 169.0 | 103.3 | -38.9 | better |
| District of Columbia | 95.0 | 51.6 | -45.7 | 95.0 | 31.2 | -67.2 | better |
| United States | 309.1 | 405.3 | 31.1 | 114.8 | 121.7 | 6.0 | little change |
Three-year averages. Direction uses SAIDI without major event days: worse = rise over 10%, better = fall over 10%. Sorted by change without major events.
Source: [2] U.S. Energy Information Administration
| Year | SAIDI with major events (min) | SAIDI without major events (min) | Major event share (%) | Hours without power | SAIFI with major events | SAIFI without major events | CAIDI with major events (min) |
|---|---|---|---|---|---|---|---|
| 2015 | 205.0 | 113.1 | 44.8 | 3.4 | 1.246 | 1.046 | 164.5 |
| 2016 | 249.2 | 116.9 | 53.1 | 4.2 | 1.292 | 1.062 | 192.9 |
| 2017 | 473.1 | 114.4 | 75.8 | 7.9 | 1.394 | 1.007 | 339.3 |
| 2018 | 346.4 | 117.2 | 66.2 | 5.8 | 1.325 | 1.028 | 261.5 |
| 2019 | 284.6 | 118.6 | 58.3 | 4.7 | 1.325 | 1.017 | 214.8 |
| 2020 | 491.9 | 119.0 | 75.8 | 8.2 | 1.440 | 1.037 | 341.7 |
| 2021 | 440.0 | 121.5 | 72.4 | 7.3 | 1.425 | 1.025 | 308.8 |
| 2022 | 335.5 | 125.7 | 62.5 | 5.6 | 1.405 | 1.064 | 238.8 |
| 2023 | 342.0 | 118.4 | 65.4 | 5.7 | 1.333 | 0.999 | 256.6 |
| 2024 | 611.3 | 126.0 | 79.4 | 10.2 | 1.521 | 1.043 | 401.9 |
| 2025 | 262.6 | 120.8 | 54.0 | 4.4 | 1.338 | 1.053 | 196.3 |
Any method. Hours = SAIDI with major event days / 60.
Source: [3] U.S. Energy Information Administration
DOE-417 disturbance reports fell to 426 in 2025 from 622 in 2024
Large incidents reported to the Department of Energy track the storm years. Reports for the 50 states and DC fell 40.5% in 2025, and incidents with loss of service to more than 50,000 customers fell 43.9%.
Utilities and grid operators must file Form DOE-417 for events such as a loss of electric service to more than 50,000 customers for 1 hour or more, physical attacks, cyber events and large load shedding (DOE-417 instructions). The DOE-417 annual summaries list 622 reports for 2024, the most of any year since at least 2013, and 426 for 2025.
Excluding events listed only for Puerto Rico or other territories, the 50 states and DC had 337 reports in 2025. Physical security events (vandalism, theft, suspicious activity including drones, and attacks) were the largest group at 131 (38.9%), followed by weather or natural disaster at 72 (21.4%), cyber at 42 and grid operations and supply at 17; 75 were other or unknown.
Reports of service loss to more than 50,000 customers, the criterion closest to what homeowners experience, numbered 64 in 2025 against 114 in 2024. The peak since 2015 was 125 in 2020. A DOE-417 report counts an incident, not customers or minutes, and a single storm can generate several reports from different utilities.
Incident reports per year, all causes and weather or natural disaster
Source: U.S. DOE, DOE-417 annual summaries; ECW count excludes territory-only events
| Year | All DOE-417 reports | 50 states and DC | Weather or natural disaster | Physical security | Grid operations and supply | Cyber | Other or unknown | Loss of service to over 50,000 customers |
|---|---|---|---|---|---|---|---|---|
| 2013 | 174 | 173 | 57 | 79 | 32 | 2 | 3 | |
| 2014 | 214 | 211 | 91 | 73 | 42 | 3 | 2 | |
| 2015 | 143 | 137 | 66 | 42 | 23 | 0 | 6 | 57 |
| 2016 | 141 | 132 | 42 | 49 | 30 | 4 | 7 | 44 |
| 2017 | 150 | 150 | 80 | 45 | 21 | 0 | 4 | 74 |
| 2018 | 220 | 220 | 102 | 58 | 60 | 0 | 0 | 81 |
| 2019 | 278 | 278 | 92 | 81 | 100 | 0 | 5 | 78 |
| 2020 | 383 | 383 | 166 | 94 | 120 | 3 | 0 | 125 |
| 2021 | 387 | 387 | 156 | 92 | 131 | 7 | 1 | 82 |
| 2022 | 390 | 390 | 95 | 163 | 119 | 9 | 4 | 77 |
| 2023 | 316 | 316 | 67 | 163 | 48 | 4 | 34 | 56 |
| 2024 | 622 | 566 | 133 | 180 | 74 | 62 | 117 | 114 |
| 2025 | 426 | 337 | 72 | 131 | 17 | 42 | 75 | 64 |
50 states and DC excludes events listed only for Puerto Rico or other territories. Cause groups are an ECW mapping of DOE's free-text event types; the 2024 form layout added cyber and drone categories, so counts before and after 2024 are not strictly comparable. The 50,000-customer column starts in 2015, when the summaries began listing alert criteria.
Source: [10][11] U.S. Department of Energy, Office of Cybersecurity, Energy Security, and Emergency Response; U.S. Department of Energy
What the outage data means for standby generators and transfer switches
Standby generator demand follows outage years, and the installation work runs through electrical contractors. The public record supports a penetration figure but not state-level install counts.
Generac, which describes itself as the home standby product category leader, estimated in its fiscal 2025 10-K that home standby units reach approximately 6.75% of its addressable market, up from approximately 6.5% in its fiscal 2024 10-K. It defines that market as single-family detached, owner-occupied US homes valued over $175,000 (Generac 10-K, filed February 18, 2026). This is a company estimate, not an independent survey.
The same filing says the second half of 2025 had a very low level of baseline power outage activity, and it attributed lower domestic home standby and portable generator sales in 2025 to a significantly lower power outage environment and a strong 2024 comparison that included multiple major landed hurricanes. That matches the EIA data: US outage minutes dropped from 611.3 in 2024 to 262.6 in 2025.
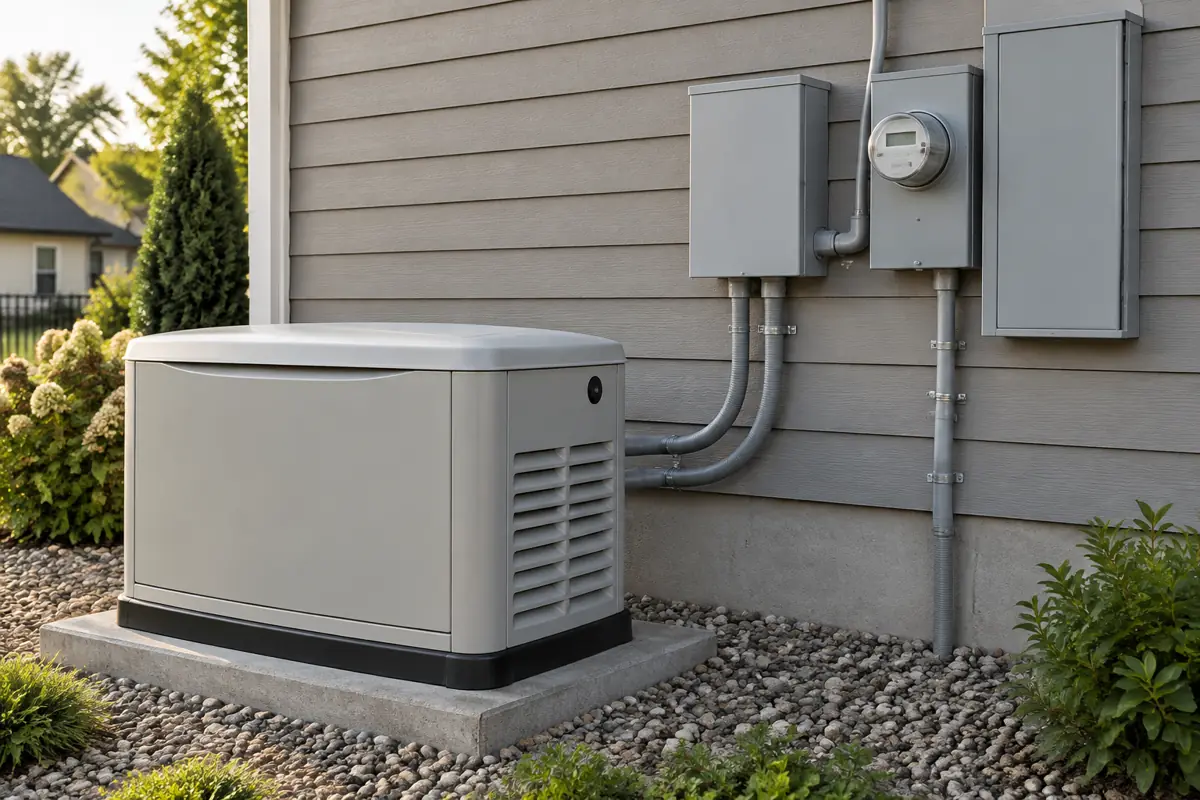
Generac's 10-K describes its residential standby generators (7.5 to 150 kW) as permanently installed with an automatic transfer switch, and says its residential dealer network is made up of electrical and HVAC contractors who sell, install and service them. Connecting a generator or battery system to a home's wiring is licensed electrical work; homeowners can find a contractor through hire an electrician, and battery backup is covered in EV, solar and low voltage.
For contractors, the state ranking is a rough guide to where outage exposure is highest. West Virginia, Mississippi and Alaska combine long ordinary-day outages with high frequency; Florida, Louisiana and the Carolinas see most of their outage time in storm years. Contractor counts by state are in electrical contractor counts by state.
How we ranked the states
Customer-weighted SAIDI and SAIFI by state, with and without major event days, 2025
Formulastate SAIDI = sum(utility SAIDI x utility customers) / sum(utility customers); same for SAIFI; CAIDI = SAIDI / SAIFI. Major event days per IEEE 1366 (Tmed threshold from five years of daily SAIDI) for IEEE reporters; self-defined for others ('any method').
Inputs: fact sheet rows for each state's saidi_w_2025, saidi_wo_2025, saifi_w_2025 and saifi_wo_2025 (EIA Table 11.3); utility rows in raw/eia861/f8612025.zip for the rebuild (fact sheet rows)
Result: US 262.6 minutes and 1.338 interruptions; rebuild from utility data within a median 0.5% of EIA's state values (38 of 52 within 2%)
EIA's published state figures can be reproduced from the utility file, so the ranking rests on a transparent calculation rather than an opaque index.
Limitations: Utilities that do not report are missing; any-method values mix IEEE and self-defined major events. Small gaps remain where EIA's customer weights differ from the reliability file.
Share of outage minutes on major event days, by state
Formula(SAIDI with MED - SAIDI without MED) / SAIDI with MED x 100, for 2024, 2025 and summed over 2015 to 2025
Inputs: fact sheet rows for saidi_w and saidi_wo by state and year (EIA Tables 11.3 and 11.4) (fact sheet rows)
Result: US 67.5% over 2015 to 2025; highest Florida 87.4%, lowest District of Columbia 21.4%
In most states storms, not routine failures, decide whether a year is good or bad for customers.
Limitations: Major event days are mostly weather but can include other atypical events; the 11-year share weights each year equally.
Change in outage minutes, 2015-2017 average to 2023-2025 average, by state
Formula(mean 2023-2025 / mean 2015-2017 - 1) x 100, separately with and without major event days; direction: worse > +10%, better < -10% (without major event days)
Inputs: fact sheet rows for saidi_w and saidi_wo, 2015 to 2017 and 2023 to 2025 (EIA Table 11.4) (fact sheet rows)
Result: US +31.1% with and +6.0% without major events; 17 states worse, 16 better, 18 little change
Nationally the increase in outage time is a storm story; state results vary widely.
Limitations: 2015 is the first year of EIA's consistent state table. Reporting coverage and utility methods changed over time; the 10% threshold is an editorial choice.
Eleven-year average outage time and rank, 2015 to 2025
Formulamean(SAIDI with MED, 2015-2025); rank 1 = longest of 51
Inputs: fact sheet rows for saidi_w by state, 2015 to 2025 (EIA Table 11.4) (fact sheet rows)
Result: Louisiana 1,110.3 minutes (rank 1); District of Columbia 68.7 (rank 51); US 367.4
A multi-year average answers 'which state has the most outages' better than a single year.
Limitations: Simple mean; a single extreme year (for example a major hurricane) still moves it.
DOE-417 incident reports by year and cause group, 2013 to 2025
Formulacount of event rows with a valid start date in each annual summary; 50 states and DC excludes rows whose area is only a territory; cause groups by keyword mapping of Event Type
Inputs: raw/doe417/*_Annual_Summary.xls(x); derived rows oe_* in derived_metrics.csv (fact sheet rows)
Result: 426 reports in 2025 (337 in the 50 states and DC), against 622 in 2024; physical security 38.9% and weather 21.4% of 2025 state reports
Reports rose through 2024 and fell back in 2025, in line with the EIA outage minutes.
Limitations: Counts incidents, not customers or minutes; one storm can generate several reports; event type wording changed in 2015 and 2024.
US customer interruptions per year
FormulaUS SAIFI (EIA Table 11.1, any method) x customers of utilities reporting reliability data (EIA-861 utility rows)
Inputs: fact rows for US SAIFI 2024 and 2025; derived rows us_reporting_customers_2024/2025 (fact sheet rows)
Result: About 206 million customer interruptions in 2025 (162 million outside major events) and 231 million in 2024.
The closest public answer to how many power outages happen in the US each year, counted per customer affected.
Limitations: Counts each customer that lost power, not distinct outage events; covers only reporting utilities; momentary interruptions excluded.
State by state
- US customers averaged 262.6 minutes without power in 2025 including major events, and 120.8 minutes excluding them (EIA, any method).[3]
- US outage minutes fell 57.0% from 2024 (611.3 minutes) to 2025, the lowest level since 2016.[3]
- West Virginia customers averaged 1,013.2 minutes (16.9 hours) without power in 2025, the most of the 50 states and DC.[1]
- West Virginia also had the longest outage time without major events in 2025, 498.1 minutes, against 120.8 for the US.[1][3]
- The District of Columbia had the shortest outage time in 2025, 50.3 minutes per customer, followed by Arizona at 69.9.[1]
- Louisiana had the highest average outage time over 2015 to 2025, 1,110.3 minutes (18.5 hours) a year.[2]
- Major event days produced 79.4% of US outage minutes in 2024 and 54.0% in 2025.[3]
- Florida had the highest major event share over 2015 to 2025, 87.4%, but only 10.1% in 2025, when its total fell to 70.5 minutes.[1][2]
- Between 2015 to 2017 and 2023 to 2025, US outage minutes including major events rose 31.1% and minutes without major events rose 6.0%.[2]
- Ordinary-day outage minutes rose more than 10% in 17 states and fell more than 10% in 16 between 2015 to 2017 and 2023 to 2025.[2]
- Hawaii's outage minutes without major events rose 68.8% between 2015 to 2017 and 2023 to 2025, the largest rise of any state.[2]
- Alaska customers had 3.203 interruptions in 2025, the most of any state; the US figure was 1.338.[1][3]
- DOE-417 annual summaries list 426 disturbance reports for 2025 and 622 for 2024.[10]
- Reports of service loss to more than 50,000 customers in the 50 states and DC fell from 114 in 2024 to 64 in 2025.[10][11]
In short
- The average US electricity customer was without power for 262.6 minutes (4.4 hours) in 2025, 57.0% less than the 611.3 minutes of hurricane-heavy 2024 (EIA Electric Power Annual 2025).
- West Virginia had the longest outage time in 2025 at 1,013.2 minutes per customer, followed by Michigan (671.5) and Nebraska (547.3); the District of Columbia had the shortest at 50.3.
- Over 2015 to 2025, Louisiana (1,110.3 minutes a year) and Maine (1,073.1) had the highest average outage time.
- Major event days accounted for 67.5% of US outage minutes from 2015 to 2025 and for more than half in 36 of 51 jurisdictions.
- Without major events, US outage minutes rose only 6.0% between 2015 to 2017 and 2023 to 2025, while minutes including major events rose 31.1%.
- On ordinary days, 17 states got worse by more than 10% and 16 improved by more than 10%; Hawaii, Alaska and California had the largest rises.
- US customers averaged 1.338 interruptions in 2025; Alaska had the most (3.203).
- DOE-417 disturbance reports fell to 426 in 2025 from 622 in 2024.
What people search for
Which state has the most power outages?
It depends on the measure. For total time without power in 2025, West Virginia ranked first at 1,013.2 minutes per customer. For the number of interruptions in 2025, Alaska ranked first at 3.203 per customer. Averaged over 2015 to 2025, Louisiana had the most time without power, 1,110.3 minutes a year (EIA Tables 11.3 and 11.4).
Which state has the most reliable power grid?
By outage time per customer, the District of Columbia: 50.3 minutes in 2025 and an 11-year average of 68.7 minutes, the lowest of the 50 states and DC. Among states, Arizona (95.5 minutes) and Nevada (120.6) had the lowest 2015 to 2025 averages. EIA's figures measure distribution outages seen by customers, not bulk grid adequacy.
Are power outages getting worse?
Storm-related outage time is up; ordinary-day outage time is close to flat. Comparing 2015 to 2017 with 2023 to 2025, US minutes without power including major events rose 31.1%, while minutes without major events rose 6.0% (EIA Table 11.4, ECW calculation). By state, 17 got worse by more than 10% on ordinary days and 16 improved by more than 10%.
What is SAIDI?
SAIDI, the System Average Interruption Duration Index, is the total minutes of sustained power interruptions the average customer of a utility experiences in a year. EIA reports it with and without major event days. The US value for 2025 was 262.6 minutes with major events and 120.8 without.
What is a major event day?
Under IEEE Standard 1366, a major event day is a day on which a utility's daily SAIDI exceeds a threshold (Tmed) calculated from the previous five years of daily data. EIA notes that major events can include severe weather, interference from vegetation near power lines and some atypical utility practices. In 2024, major event days produced 79.4% of US outage minutes (EIA, any method).
Common questions
How long do power outages last?
In the US the average interruption lasted 196.3 minutes (3.3 hours) in 2025 including major events, and 114.7 minutes (1.9 hours) excluding them (EIA Electric Power Annual 2025, Table 11.1). Storm years run longer: 401.9 minutes in 2024. By state, interruptions lasted longest in Michigan (471.6 minutes) and shortest in Arizona (78.3). Across the year, the average customer was without power for 262.6 minutes in total.
How many power outages happen in the US each year?
No public count of every outage exists. EIA reports 1.338 sustained interruptions per customer in 2025 and 1.521 in 2024. Across the customers of utilities that reported reliability data (153.9 million in 2025), that is about 206 million customer interruptions in 2025 and 231 million in 2024 (ECW estimate). For large incidents, DOE-417 summaries list 426 reports in 2025, including 64 in the 50 states and DC where more than 50,000 customers lost service for 1 hour or more.
How long do power outages last in Texas?
Texas customers averaged 223.5 minutes (3.7 hours) without power in 2025, ranking 30 of 51, down from 1,270.6 minutes in 2024, the year Hurricane Beryl left 2.6 million Texas customers without power. The 2015 to 2025 average was 475.3 minutes a year (EIA).
How long do power outages last in Florida?
Florida customers averaged 70.5 minutes without power in 2025, third lowest of the 50 states and DC, after 1,321.5 minutes in 2024. Over 2015 to 2025 Florida averaged 574.9 minutes a year, and 87.4% of its outage minutes fell on major event days, the highest share of any state (EIA).
How long do power outages last in California?
California customers averaged 344.6 minutes (5.7 hours) without power in 2025, ranking 15 of 51. Its outage minutes without major events rose 52.7% between 2015 to 2017 and 2023 to 2025, the third largest rise of any state (EIA Table 11.4, ECW calculation).
Why were there fewer power outage hours in 2025 than in 2024?
2024 had Hurricanes Beryl, Helene and Milton; EIA attributed 80% of 2024 outage hours to major events. In 2025, major event days produced 54.0% of US outage minutes, and the US total fell 57.0% to 262.6 minutes. Generac's 10-K describes the second half of 2025 as a very low level of baseline outage activity.
Which states have the most frequent power outages?
In 2025 Alaska (3.203 interruptions per customer), West Virginia (3.082), Mississippi (2.594), Louisiana (2.324) and Maine (2.240) had the most. The US figure was 1.338 (EIA Table 11.3).
What counts as a large power outage for the Department of Energy?
Form DOE-417 must be filed when, among other criteria, more than 50,000 customers lose electric service for 1 hour or more; the normal report is due within six hours. In the 50 states and DC there were 64 such reports in 2025 and 114 in 2024 (DOE-417 annual summaries, ECW count).
How many homes have a standby generator?
No government survey in this report's sources counts them. Generac's fiscal 2025 10-K estimates home standby penetration at approximately 6.75% of single-family detached, owner-occupied US homes valued over $175,000, up from approximately 6.5% in its fiscal 2024 10-K. Installation and the transfer switch connection are work for a licensed electrician.
Does this ranking include Puerto Rico?
No. The ranking covers the 50 states and DC. EIA reported that Puerto Rico customers averaged 36 hours of interruptions outside major events in 2025, 19% more than in 2024, plus 23 hours from major events (EIA Today in Energy, August 10, 2026).
Get the data
Every table in this report is available as a CSV under CC BY 4.0. The fact sheet lists each value with its source URL and access date.
- derived_metrics.csv (CSV)
- fact_sheet.csv (CSV)
- Power outages by state, 2025: minutes and hours without power, frequency and restoration time (CSV)
- How much of each state's outage time comes from major events, 2015 to 2025 (CSV)
- How often the power goes out: interruptions per customer by state, 2025 and 2024 (CSV)
- Outage minutes by state, 2015 to 2017 versus 2023 to 2025 (CSV)
- US distribution reliability, 2015 to 2025 (CSV)
- DOE-417 electric emergency and disturbance reports by year and cause group, 2013 to 2025 (CSV)
Cite this report
The figures to cite first
- The average US electricity customer was without power for 262.6 minutes in 2025 (4.4 hours), including major events (EIA Electric Power Annual 2025).[3]
- West Virginia had the longest outage time of the 50 states and DC in 2025: 1,013.2 minutes per customer (EIA).[1]
- From 2015 to 2025, 67.5% of US outage minutes fell on major event days (ECW calculation from EIA Table 11.4).[2]
- In 2025 the average US power interruption lasted 196.3 minutes (3.3 hours) including major events and 114.7 minutes (1.9 hours) excluding them (EIA Electric Power Annual 2025, Table 11.1).[3]
- US electricity customers had about 206 million customer interruptions in 2025: 1.338 per customer across the 153.9 million customers of reporting utilities (ECW estimate from EIA data).[3][5]
Quotable figures
- In 2025 the average US electricity customer was without power for 262.6 minutes, or 4.4 hours, according to EIA's Electric Power Annual 2025.[3]
- West Virginia customers averaged 16.9 hours without power in 2025, the longest of the 50 states and the District of Columbia.[1]
- Major event days caused 67.5% of US outage minutes between 2015 and 2025.[2]
- Outside major events, US outage minutes rose just 6.0% between 2015 to 2017 and 2023 to 2025.[2]
- Louisiana averaged 18.5 hours without power per customer per year from 2015 to 2025, the most of any state.[2]
- Utilities filed 426 DOE-417 disturbance reports in 2025, down from 622 in 2024.[10]
Summary for editors
US electricity customers averaged 262.6 minutes, or 4.4 hours, without power in 2025, down 57.0% from 2024, according to Energy Information Administration data analysed by the Electrical Contractors and Wiring Data Desk. West Virginia had the longest outage time at 16.9 hours per customer, and the District of Columbia the shortest at 0.8. Over 2015 to 2025, Louisiana averaged 18.5 hours a year. Major event days, mostly storms, accounted for 67.5% of US outage minutes across those 11 years. Outside major events, the national figure rose only 6.0% between 2015 to 2017 and 2023 to 2025, while 17 states got worse by more than 10% and 16 improved by more than 10%. Department of Energy disturbance reports fell to 426 in 2025 from 622 in 2024. State tables and CSV files are free to reuse under CC BY 4.0.
Headlines the data supports
- US customers averaged 4.4 hours without power in 2025, down from 10.2 in 2024
- West Virginia tops the 2025 power outage ranking at 16.9 hours per customer
- Major storms caused 67.5% of US outage minutes over the past 11 years
- Ordinary-day power outages got worse in 17 states and better in 16 since 2015
- Reports of grid disturbances fell to 426 in 2025 after a peak of 622
Citation
Electrical Contractors and Wiring. (2026). Power Outages by State: How Long, How Often and Which States Are Getting Worse, 2015 to 2025. Retrieved from https://electricalcontractorsandwiring.com/data/power-outages-by-state/
Reuse
Data and tables are licensed CC BY 4.0. Attribution: “Source: Electrical Contractors and Wiring, Power Outages by State: How Long, How Often and Which States Are Getting Worse, 2015 to 2025” with a link to this page.
How we built this report
Source selection: state and national reliability figures come from the U.S. Energy Information Administration (EIA) Electric Power Annual 2025, Tables 11.1, 11.3 and 11.4, released October 21, 2026. They are built from Form EIA-861 utility reports; the final 2025 EIA-861 files were released October 7, 2026. The 'any method' series is used throughout because it combines utilities that follow IEEE Standard 1366 with those that do not, covering 94.7% of US customers in 2025. Incident counts come from the U.S. Department of Energy DOE-417 annual summaries for 2013 to 2025, downloaded from doe417.pnnl.gov. Generac's 10-K filings are used only for a dated, company-stated penetration figure.
Inclusion and exclusion: the ranking covers the 50 states and the District of Columbia. Puerto Rico and other territories are excluded from rankings and from the DOE-417 '50 states and DC' counts, but Puerto Rico is described from EIA's own analysis. Momentary interruptions are not part of SAIDI or SAIFI. Market estimates and third-party rankings are cited only as pages compared against.
Validation: the 2025 state values were rebuilt from the utility-level file Reliability_2025.xlsx by weighting each utility's SAIDI by its reported customers, using the IEEE value where reported and the utility's own value otherwise. The rebuild came within a median 0.5% of EIA's Table 11.3 values, and within 2% for 38 of 52 jurisdictions; the rebuilt US figure was 260.9 minutes against EIA's 262.6. The 'State Totals' tab inside the same workbook covers fewer customers for some states (for example 369.1 minutes for Missouri across 1,472,695 customers, against 457.2 minutes in Table 11.3), so the Electric Power Annual tables are used.
Conflicting numbers: EIA's December 2025 article gives 11 hours for 2024, based on IEEE reporters (662.6 minutes, 11.0 hours); the any-method figure used here is 611.3 minutes (10.2 hours). The article's 80% major event share for 2024 matches the IEEE series (80.1%); the any-method share is 79.4%. EIA's 'nearly 53 hours' for South Carolina in 2024 compares with 3,136.5 minutes (52.3 hours) in Table 11.3. Both are shown where relevant.
Derived metrics: hours = SAIDI / 60; major event share = (SAIDI with minus SAIDI without) / SAIDI with; trend = change between three-year averages for 2015 to 2017 and 2023 to 2025, so that one storm year does not decide a state's direction; a state is 'worse' or 'better' when its ordinary-day SAIDI moved more than 10%. Every formula and input row is in derived_metrics.csv, and scripts/ rebuilds all files from raw/. Restoration time per interruption is EIA's CAIDI (SAIDI / SAIFI); hours = minutes / 60. US customer interruptions = US SAIFI x customers of utilities reporting reliability data in the EIA-861 file (ECW estimate, added 2026-11-03).
DOE-417 handling: the original OE-417 host (oe.netl.doe.gov) did not resolve on October 27, 2026; an Internet Archive copy of its summaries page from December 9, 2024 lists years through 2023, and the same annual files, plus 2024 and 2025, are now served by the DOE-417 site. A report is counted when its row has a valid start date. Cause groups (weather, physical security, grid operations and supply, cyber, other) are an ECW keyword mapping of DOE's free-text event types. The 2024 and 2025 files use a new layout with more categories, including cyber and drone sightings, so cause counts before and after 2024 are not strictly comparable. EIA's Electric Power Monthly Table B.1, which republishes these events, lists only January 1 to March 30, 2024 and was not used for counts.
Limitations: SAIDI and SAIFI are averages across customers; many customers had no outage and some had far more. Coverage varies by state, from 74.1% of customers in Nebraska to near complete in others. Major event days are defined per utility, so a storm counts differently across utilities. A 'customer' is a metered account, not a person. Nothing here is engineering, financial or safety advice.
Last updated: October 27, 2026. Next update: after the Electric Power Annual 2026 (expected October 2027) or the 2026 DOE-417 annual summary, whichever comes first.
This report presents published data with its limitations. It is not legal, financial or investment advice.
Sources by tier
Tier 1: primary and official sources (14)
- [1] U.S. Energy Information Administration. Electric Power Annual 2025, Table 11.3: Reliability metrics using any method of U.S. distribution system by state, 2025 and 2024. 2024 and 2025 (released 2026-10-21). Accessed 2026-10-27.
- [2] U.S. Energy Information Administration. Electric Power Annual 2025, Table 11.4: SAIDI values of U.S. distribution system by state, 2015 to 2025. 2015 to 2025. Accessed 2026-10-27.
- [3] U.S. Energy Information Administration. Electric Power Annual 2025, Table 11.1: Reliability metrics of U.S. distribution system. 2015 to 2025. Accessed 2026-10-27.
- [4] U.S. Energy Information Administration. Electric Power Annual (release date October 21, 2026; next release October 2027). 2025 data year. Accessed 2026-10-27.
- [5] U.S. Energy Information Administration. Annual Electric Power Industry Report, Form EIA-861, 2025 final data (Reliability_2025.xlsx). 2025. Accessed 2026-10-27.
- [6] U.S. Energy Information Administration. Annual Electric Power Industry Report, Form EIA-861, archived data files 2013 to 2024. 2013 to 2024. Accessed 2026-10-27.
- [7] U.S. Energy Information Administration. Hurricanes in 2024 led to the most hours without power in the United States in 10 years (Today in Energy, December 1, 2025). 2024. Accessed 2026-10-27.
- [8] U.S. Energy Information Administration. Duration of power outages in Puerto Rico not caused by major events increased 19% in 2025 (Today in Energy, August 10, 2026). 2021 to 2025. Accessed 2026-10-27.
- [9] U.S. Energy Information Administration. Average frequency and duration of electric distribution outages vary by states (Today in Energy, April 5, 2018). 2016. Accessed 2026-10-27.
- [10] U.S. Department of Energy, Office of Cybersecurity, Energy Security, and Emergency Response. DOE-417 Electric Emergency Incident and Disturbance Report, annual summaries 2013 to 2025. 2013 to 2025 (2024 and 2025 files generated 10/7/2026). Accessed 2026-10-27.
- [11] U.S. Department of Energy. Form DOE-417 instructions (OMB No. 1901-0288, expires 05/31/2027). current form. Accessed 2026-10-27.
- [12] U.S. Department of Energy (archived by the Internet Archive). Electric Disturbance Events (OE-417) Annual Summaries page, Internet Archive copy of December 9, 2024 (original host unreachable on 2026-10-27). 2000 to 2023 listings. Accessed 2026-10-27.
- [13] U.S. Energy Information Administration. Electric Power Monthly (data for August 2026, released October 23, 2026), Table B.1: Major disturbances and unusual occurrences. January 1 to March 30, 2024. Accessed 2026-10-27.
- [16] U.S. Energy Information Administration. Annual Electric Power Industry Report (EIA-861 data file) page: 2025 final data released October 7, 2026; next release August 2027 (early release). 2001 to 2025. Accessed 2026-10-27.
Tier 2: trade bodies, market research, company data (2)
- [14] Generac Holdings Inc. via SEC EDGAR. Generac Holdings Inc. Form 10-K for fiscal year 2025 (filed February 18, 2026). fiscal year 2025. Accessed 2026-10-27.
- [15] Generac Holdings Inc. via SEC EDGAR. Generac Holdings Inc. Form 10-K for fiscal year 2024 (filed February 19, 2025). fiscal year 2024. Accessed 2026-10-27.
Tier 3: journalism and expert commentary (4)
- [17] MRO Electric. U.S. power outages by state (June 28, 2024). 2018 to 2022. Accessed 2026-10-27.
- [18] ROI-NJ. N.J. ranked 25th among states most at risk for power outages in 2025 (June 3, 2025). May to August, 2019 to 2023. Accessed 2026-10-27.
- [19] Government Technology. Which state experiences the most power outages?. 2018 to 2022. Accessed 2026-10-27.
- [20] EC&M. U.S. States with the Most Power Outages (March 9, 2021). EIA data as reported by MRO Electric. Accessed 2026-10-27.