Electrical Fire Statistics: How Many US Fires, What Starts Them and the Harm They Do
- Data
- USFA NFIRS national estimates (2014 to 2023); NFPA Home Electrical Fires (May 2026); CPSC 2021 to 2023 Residential Fire Loss Estimates (October 2026)
- Period
- 2014 to 2024 (latest year varies by publisher)
- Release used
- 2026-10-13
- Next release
- Annual: NFPA and CPSC each publish once a year; USFA cause estimates for 2024 not yet posted
- Geography
- United States
- Sources
- 23 (22 official)
The latest electrical fire statistics show US fire departments answer about 46,652 home electrical fires a year (NFPA, 2020 to 2024 average), with 527 deaths, 1,580 injuries and $2.4 billion in damage. The narrower USFA count was 23,700 residential electrical malfunction fires and 305 deaths in 2023. Installed wiring is the leading item involved.
Electrical fire statistics range from 18,400 to 56,900 fires a year depending on the definition
Three federal and industry publishers count US electrical fires in five different ways. The counts overlap and are not additive, which is why figures quoted online differ by a factor of three.
NFPA's May 2026 report Home Electrical Fires uses the widest home-only definition: a fire counts if an electrical failure or malfunction contributed to ignition, or if electrical distribution, lighting or power transfer equipment was involved. On that basis US fire departments responded to an annual average of 46,652 home electrical fires in 2020 to 2024, with 527 civilian deaths, 1,580 injuries and $2.4 billion in direct property damage a year.
Electrical failure or malfunction: An NFIRS factor contributing to ignition, such as a short-circuit arc or a worn insulation fault. It can apply to any powered item, including a dryer or a range, not only to building wiring.
Electrical distribution and lighting equipment: An NFIRS equipment-involved-in-ignition group. NFPA defines it as installed wiring, outlets, switches, cords, plugs, power supplies and lighting.
Electrical malfunction (USFA cause): One of the USFA cause categories. Each fire is assigned a single cause through a hierarchy, so a fire coded to another cause first is not counted here.
The U.S. Fire Administration's narrower cause category gave 23,700 residential building electrical malfunction fires in 2023, with 305 deaths, 800 injuries and $1.5 billion in dollar loss (USFA). The NFPA combined count is 1.97 times this figure. The CPSC's 2021 to 2023 Residential Fire Loss Estimates isolate unintentional fires where electrical distribution equipment was involved in ignition: 18,400 fires, 210 deaths and 720 injuries a year, or 5.2% of residential fires. CPSC's broadest group, any electrically powered equipment, reaches 56,900 fires a year because it adds electric ranges, heaters, dryers and other appliances.
| Definition | Publisher and period | Scope | Fires per year | Deaths per year | Injuries per year | Property loss per year |
|---|---|---|---|---|---|---|
| Fires involving any electrically powered equipment | CPSC, 2021 to 2023 avg | Unintentional residential structure fires | 56,900 | 550 | 2,980 | $2,181.1 million (nominal) |
| Electrical failure or malfunction factor OR electrical distribution, lighting or power transfer equipment | NFPA, 2020 to 2024 avg | Home structure fires | 46,652 | 527 | 1,580 | $2.4 billion (2024 dollars) |
| Electrical distribution or lighting equipment involved in ignition | NFPA, 2019 to 2023 avg | Home structure fires | 31,650 | 430 | 1,300 | $1.6 billion |
| Electrical malfunction as the assigned cause | USFA, 2023 | Residential buildings incl. hotels, dorms, care facilities | 23,700 | 305 | 800 | $1,501.6 million |
| Electrical distribution equipment involved in ignition | CPSC, 2021 to 2023 avg | Unintentional residential structure fires | 18,400 | 210 | 720 | $870.3 million (nominal) |
| Undated figure in circulation | ESFI web page, no data year given | Home fires | 51,000 | 500 | 1,400 | $1.3 billion |
Counts are not additive: each definition overlaps the others. Periods differ. ESFI figure has no stated data year.
Source: [1][7][9][11][23] U.S. Fire Administration (FEMA); National Fire Protection Association (NFPA Research); National Fire Protection Association (NFPA Research); U.S. Consumer Product Safety Commission; Electrical Safety Foundation International (ESFI)
Fires per year under five published definitions (periods differ)
Sources: CPSC (October 2026), NFPA (May 2026 and August 2025), USFA (2023 estimates)
Electrical fires held level for a decade while other residential fires declined
USFA counts of residential electrical malfunction fires moved within a narrow band from 2014 to 2023. Because all residential fires fell, electrical fires became a slightly larger share of the total.
USFA estimates put residential building electrical malfunction fires between 23,400 and 26,100 a year from 2014 to 2023. USFA describes the decade as a 2% increase in fires, a 19% decrease in deaths, a 2% increase in injuries and a 28% increase in inflation-adjusted dollar loss. All residential building fires fell 6% over the same period by USFA's measure.
An ECW index with 2014 set to 100 shows residential electrical malfunction fires at 99.2 in 2023, against 90.8 for all residential building fires. The electrical share of residential fires rose from 6.3% in 2014 to 6.9% in 2023, with a peak of 7.0% in 2022. Over the ten years USFA estimates 243,300 residential electrical malfunction fires and 2,590 deaths.
Index of fire counts, 2014 = 100, US residential buildings
Source: U.S. Fire Administration national estimates (2014 to 2023); ECW index
Share of US residential building fires and fire deaths assigned to electrical malfunction, 2014 to 2023
Source: U.S. Fire Administration national estimates (2014 to 2023); ECW calculation
| Year | Electrical malfunction fires | Deaths | Injuries | Dollar loss ($ millions, nominal) | All residential building fires | All residential deaths | Electrical share of fires (%) | Electrical share of deaths (%) |
|---|---|---|---|---|---|---|---|---|
| 2014 | 23,900 | 325 | 925 | 1,196.2 | 379,500 | 2,765 | 6.3 | 11.8 |
| 2015 | 24,500 | 290 | 850 | 1,220.3 | 380,900 | 2,565 | 6.4 | 11.3 |
| 2016 | 23,500 | 310 | 800 | 1,151.5 | 364,300 | 2,775 | 6.5 | 11.2 |
| 2017 | 24,100 | 200 | 750 | 1,314.9 | 371,500 | 2,695 | 6.5 | 7.4 |
| 2018 | 25,700 | 255 | 825 | 1,489.4 | 379,600 | 2,790 | 6.8 | 9.1 |
| 2019 | 24,200 | 225 | 1,050 | 1,440.1 | 354,400 | 2,830 | 6.8 | 8.0 |
| 2020 | 23,400 | 200 | 975 | 1,337.3 | 372,000 | 2,615 | 6.3 | 7.6 |
| 2021 | 24,200 | 295 | 900 | 1,351.0 | 353,500 | 2,840 | 6.8 | 10.4 |
| 2022 | 26,100 | 185 | 850 | 1,553.8 | 374,300 | 2,720 | 7.0 | 6.8 |
| 2023 | 23,700 | 305 | 800 | 1,501.6 | 344,600 | 2,890 | 6.9 | 10.6 |
USFA national estimates. Dollar loss in nominal dollars. Shares calculated by ECW from USFA counts.
Source: [1][2] U.S. Fire Administration (FEMA); U.S. Fire Administration (FEMA)
NFPA's combined home series points the same way over a longer window: 41,390 home electrical fires in 2010, a peak of 49,940 in 2022, 46,080 in 2023 and 48,757 in 2024. The 2024 figure equals an index of 117.8 on a 2010 base. In 2024, home electrical fires were 14.8% of all US home structure fires and caused 20.3% of home fire deaths (ECW calculation from NFPA's Fire Loss in the United States During 2024 and the Home Electrical Fires supporting tables).
Nonresidential buildings add a smaller stream: USFA estimated 7,400 nonresidential building electrical malfunction fires and $354.4 million in dollar loss in 2023, and describes a 7% decrease in those fires from 2014 to 2023. USFA does not publish deaths or injuries by cause for nonresidential buildings.
Installed wiring starts more electrical fires than outlets, cords and lighting combined
Within electrical distribution equipment, installed wiring is the single largest item. Outlets and switches, cords and plugs, and light fixtures follow, and many fires start out of sight in attics and walls.
CPSC's 2021 to 2023 estimates break down the 18,500 unintentional residential fires a year involving electrical distribution equipment (Table 4a). Installed wiring was involved in 8,200 fires a year (44.3%), receptacles and switches in 2,600 (14.1%), cords and plugs in 1,700 (9.2%), light fixtures in 1,300 and lamps or bulbs in 500. Light fixtures plus lamps and bulbs make up 9.7% of the total. Panel boards were involved in 600 fires a year but $103.1 million in property loss, or $171,833 per fire, a figure lifted by large losses in 2023.
| Item (equipment involved in ignition) | Fires per year | Share of distribution fires (%) | Deaths per year | Injuries per year | Property loss per year ($ millions) |
|---|---|---|---|---|---|
| Installed wiring | 8,200 | 44.3 | 90 | 220 | 337.0 |
| Receptacle, switch | 2,600 | 14.1 | 30 | 70 | 103.3 |
| Cord, plug | 1,700 | 9.2 | 50 | 120 | 85.6 |
| Light fixture | 1,300 | 7.0 | under 10 | 30 | 41.3 |
| Panel board | 600 | 3.2 | 10 | 20 | 103.1 |
| Lamp, light bulb | 500 | 2.7 | 10 | 20 | 22.0 |
| Meter | 500 | 2.7 | under 10 | 10 | 13.8 |
| Transformer | 100 | 0.5 | under 10 | under 10 | 5.1 |
| Other electrical distribution | 2,900 | 15.7 | 30 | 210 | 141.9 |
| Total electrical distribution equipment | 18,500 | 100.0 | 210 | 690 | 853.1 |
CPSC Tables 4a to 4d. CPSC rounds fires to the nearest 100 and casualties to the nearest 10; 'under 10' marks CPSC asterisks. Shares calculated by ECW on the Table 4a total of 18,500. Property loss in nominal dollars.
Source: [11] U.S. Consumer Product Safety Commission
Unintentional residential fires per year by item involved in ignition, US, 2021 to 2023 average
Source: U.S. Consumer Product Safety Commission, 2021 to 2023 Residential Fire Loss Estimates (October 2026)
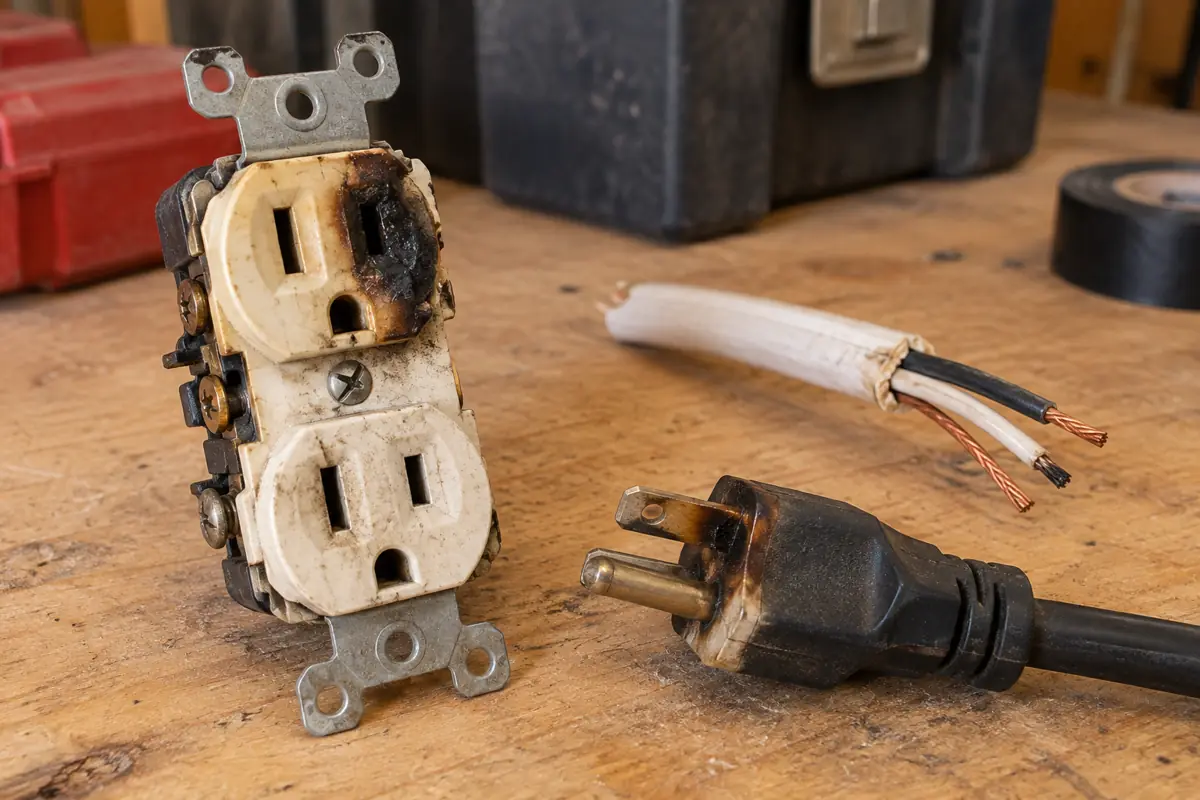
NFPA's 2020 to 2024 data show where in the home the combined category of electrical fires begins: kitchens or cooking areas (15%), bedrooms (12%) and attics or ceiling and roof assemblies (9%). Cable wire or cable insulation was the item first ignited in 36% of home electrical fires, and arcing from operating equipment was the heat source in 64%. Electrical distribution, lighting or power transfer equipment was involved in 47% of the fires but 60% of the deaths and injuries.
The last USFA topical report on the subject, covering 2014 to 2016, recorded the same pattern for specific equipment: other electrical wiring (30.5%), outlets and receptacles (12.0%), branch circuits (7.6%), extension cords (5%), panel boards (4%) and other lamps and lighting (4%) (USFA, December 2018). Bedrooms (15.4%) and attics or crawl spaces above the top story (13.0%) were the leading areas of origin, and wall assemblies accounted for 8.7%.
Electrical fires peak in winter and are deadliest overnight
Electrical fires cluster in the coldest months and in one- and two-family homes. Fires that start while people sleep are a minority of incidents but a majority of deaths.
NFPA found that December, January and February together accounted for 28% of US home electrical fires and 39% of the associated deaths in 2020 to 2024. Outside winter, July had the next greatest share at 9%. USFA's 2014 to 2016 data also show January as the peak month (12.1% of residential electrical fires) and September as the lowest (6.3%).
Time of day matters more for deaths than for incidence. Fires between midnight and 8 a.m. were 22% of home electrical fires but 52% of the deaths in 2020 to 2024, while fires between noon and 8 p.m. were 44% of fires and 24% of deaths (NFPA). By room, living room fires were 7% of home electrical fires but 27% of the deaths, and bedroom fires accounted for 21% of the deaths.
Building type is skewed too. In 2014 to 2016, one- and two-family dwellings accounted for 82.9% of residential building electrical fires against 60.0% of nonelectrical fires; multifamily buildings accounted for 11.7% (USFA). USFA suggests stricter inspection rules and professional maintenance in multifamily buildings as one explanation. Electrical fires also spread further: only 16.5% stayed within the object of origin, against 64.0% of nonelectrical fires.
Electrical fires kill more people per fire than the average home fire
Deaths, injuries and dollar loss per fire are higher for electrical fires than for residential fires as a whole under every dataset checked here.
Using USFA estimates for 2014 to 2023, residential electrical malfunction fires caused 10.6 deaths per 1,000 fires against 7.5 for all residential building fires, a ratio of 1.42. Injuries ran at 35.9 per 1,000 electrical fires against 30.9. The death rate is volatile because the counts are small: it ranged from 7.1 per 1,000 in 2022 to 13.6 in 2014.
Civilian deaths per 1,000 fires, US residential buildings, 2014 to 2023
Source: U.S. Fire Administration national estimates; ECW calculation
| Year | Deaths per 1,000 electrical fires | Deaths per 1,000 all residential fires | Injuries per 1,000 electrical fires | Injuries per 1,000 all residential fires | Loss per electrical fire ($) | Loss per residential fire ($) |
|---|---|---|---|---|---|---|
| 2014 | 13.6 | 7.3 | 38.7 | 31.8 | 50,050 | 23,403 |
| 2015 | 11.8 | 6.7 | 34.7 | 30.1 | 49,808 | 23,961 |
| 2016 | 13.2 | 7.6 | 34.0 | 30.3 | 49,000 | 25,515 |
| 2017 | 8.3 | 7.3 | 31.1 | 29.1 | 54,560 | 26,089 |
| 2018 | 9.9 | 7.3 | 32.1 | 30.4 | 57,953 | 26,195 |
| 2019 | 9.3 | 8.0 | 43.4 | 35.6 | 59,508 | 26,456 |
| 2020 | 8.5 | 7.0 | 41.7 | 31.8 | 57,150 | 27,231 |
| 2021 | 12.2 | 8.0 | 37.2 | 32.2 | 55,826 | 28,171 |
| 2022 | 7.1 | 7.3 | 32.6 | 27.4 | 59,533 | 30,101 |
| 2023 | 12.9 | 8.4 | 33.8 | 30.2 | 63,359 | 32,694 |
| 2014 to 2023 pooled | 10.6 | 7.5 | 35.9 | 30.9 |
Calculated by ECW from USFA estimates (deaths or injuries divided by fires, times 1,000). Pooled row sums all ten years.
Source: [1][2] U.S. Fire Administration (FEMA); U.S. Fire Administration (FEMA)
NFPA data give a similar gap. The combined home electrical category caused 11.3 deaths and 33.9 injuries per 1,000 fires in 2020 to 2024. In 2024 alone the rate was 12.2 deaths per 1,000 home electrical fires, against 8.9 deaths per 1,000 for all reported home fires, a ratio of 1.37. CPSC's unintentional fires show 11.4 deaths per 1,000 electrical distribution fires against 7.1 per 1,000 unintentional residential fires in 2021 to 2023.
Dollar loss follows the same pattern. The average residential electrical malfunction fire cost $63,359 in 2023, 1.94 times the $32,694 average for all residential building fires (USFA, nominal dollars). CPSC puts property loss at $47,299 per electrical distribution fire against $27,431 per unintentional residential fire. USFA's topical report links this to fires hidden in walls and attics that are detected late.
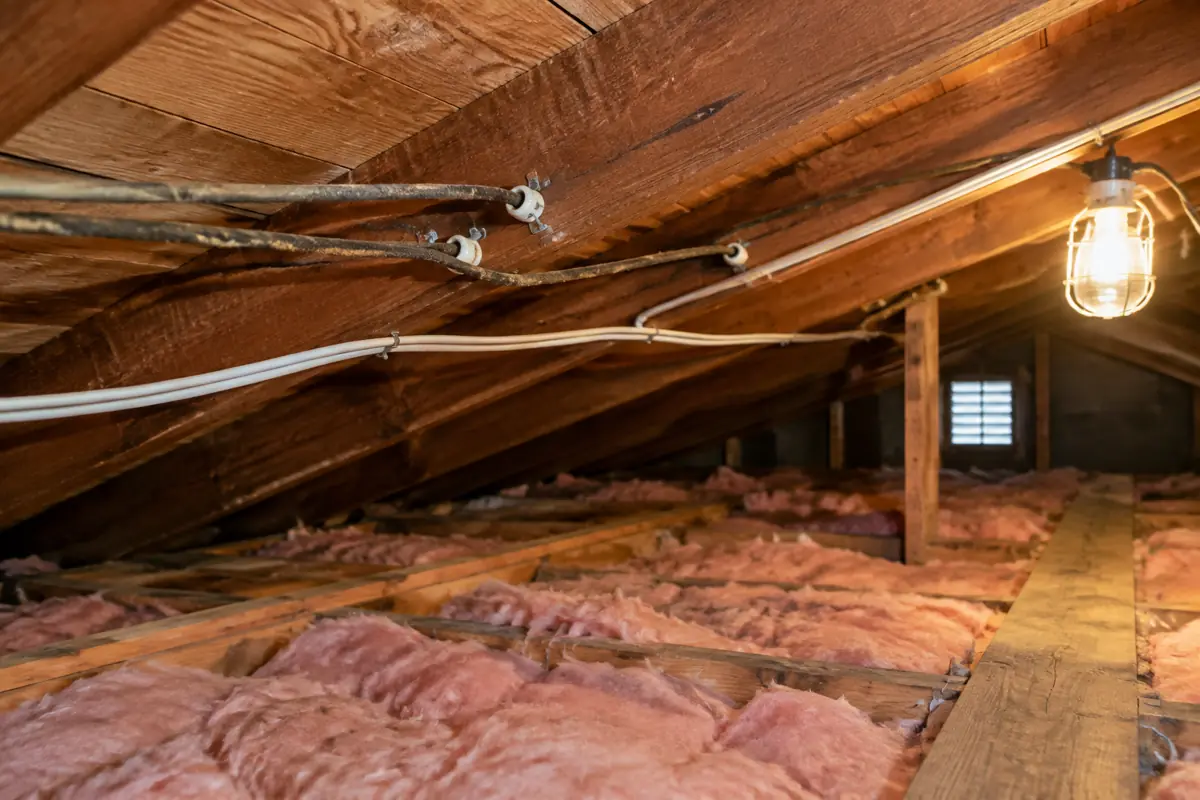
Among distribution items, cords and plugs have the highest death rate in the CPSC data: 50 deaths a year from 1,700 fires, or 29.4 per 1,000. Installed wiring caused 90 deaths a year from 8,200 fires (11.0 per 1,000) and receptacles and switches 30 deaths from 2,600 fires (11.5 per 1,000). CPSC rounds deaths to the nearest 10, so these item rates carry wide uncertainty.
Older homes report more electrical warning signs, but fire data do not measure risk by home age
No national fire dataset publishes electrical fire rates by year built. Survey data on blown fuses and exposed wiring show more warning signs in homes built before 1960, with a rise again in the newest homes.
USFA's 2018 topical report states that elevated electrical fire risk may be particularly true for homes more than 40 years old, with older wiring and systems that may not meet current code, but it does not quantify a rate. The 2023 American Housing Survey offers a related measure. In an ECW weighted tabulation of 133.2 million occupied homes, 9.1% of homes built before 1960 reported a blown fuse or tripped breaker in the prior three months, against 6.2% of homes built 2000 to 2009, a ratio of 1.47. Exposed wiring in living areas was reported in 3.5% of pre-1960 homes against 1.9% of 2000 to 2009 homes.
| Year built | Occupied homes (millions) | Blown fuse or tripped breaker in last 3 months (%) | Exposed wiring in living areas (%) | Sample units |
|---|---|---|---|---|
| Built before 1960 | 34.3 | 9.1 | 3.5 | 12,429 |
| Built 1960 to 1979 | 32.4 | 7.9 | 3.0 | 12,352 |
| Built 1980 to 1999 | 33.7 | 6.9 | 2.4 | 12,572 |
| Built 2000 to 2009 | 17.7 | 6.2 | 1.9 | 6,511 |
| Built 2010 to 2023 | 15.0 | 8.8 | 2.6 | 4,663 |
| All occupied homes | 133.2 | 7.8 | 2.8 | 48,527 |
ECW weighted tabulation of the AHS 2023 national public use file. Not fire data. National blown-fuse share matches the Census published estimate (10,429 thousand homes). Sampling error not shown.
Source: [20][21] U.S. Census Bureau and HUD; U.S. Census Bureau
Share of occupied US homes, by year built, 2023
Source: U.S. Census Bureau and HUD, American Housing Survey 2023 public use file; ECW tabulation
Electrical work requirements depend on the code edition each state has adopted; see NEC adoption by state and the state electrical license lookup for local rules.
CPSC recalled 11 electrical distribution and lighting products for fire hazards since January 2025
Recalls are a leading indicator rather than a fire count. Since January 2025 most fire-hazard recalls involved batteries and appliances, with a smaller group of power strips, adaptors, cables and light fixtures.
ECW pulled all 910 CPSC recalls dated January 1, 2025 to October 26, 2026 from the keyless SaferProducts.gov recalls API. Of these, 159 named a fire hazard in the recall title. Eleven (6.9%) involved electrical distribution, wiring or lighting products, covering about 322,393 units. Batteries, chargers, power banks, e-bikes and scooters accounted for 33 (20.8%).
| Recall date | Recall number | Product type | Units (approx.) | Recall notice |
|---|---|---|---|---|
| 2026-10-01 | 27007 | Floor lamp | 4,200 | https://cpsc.gov/Recalls/2027/Designs-Direct-Recalls-Cupcakes-and-Cashmere-Brand-Three-Light-Floor-Lamps-Due-to-Risk-of-Serious-Injury-from-Fire-and-Burn-Hazards |
| 2026-07-02 | 26599 | LED light fixture (high bay) | 42,000 | https://www.cpsc.gov/Recalls/2026/Cooper-Lighting-Recalls-Metalux-Optimized-High-Bay-LED-Light-Fixtures-Due-to-Fire-Hazard |
| 2026-05-21 | 26504 | Decorative LED light | 2,000 | https://www.cpsc.gov/Recalls/2026/Bethlehem-Lights-Recalls-Bethlehem-Lights-10-inch-Illuminated-Ribbon-Spheres-Due-to-Risk-of-Serious-Injury-or-Death-from-Fire-Hazard-Sold-by-QVC |
| 2026-03-26 | 26346 | Power strip | 5,543 | https://www.cpsc.gov/Recalls/2026/CCCEI-Brand-Power-Strips-Recalled-Due-to-Risk-of-Serious-Injury-or-Death-from-Fire-Sold-by-Middle-Way-Electronics |
| 2026-02-26 | 26278 | LED light fixture (high bay) | 186,520 | https://www.cpsc.gov/Recalls/2026/PQL-Recalls-High-Bay-Linear-LED-Light-Fixtures-Due-to-Fire-Hazard |
| 2025-12-18 | 26161 | Power strip | 11,200 | https://www.cpsc.gov/Recalls/2026/ANNQUAN-Brand-Power-Strips-Recalled-Due-to-Risk-of-Serious-Injury-or-Death-from-Fire-Sold-on-Amazon-by-Hefei-Juyuan-Sporting-Development |
| 2025-08-14 | 25436 | LED stair and rail lighting module | 2,720 | https://www.cpsc.gov/Recalls/2025/Viewrail-Recalls-Electronic-LED-Modules-used-with-Floating-Stairs-and-Rails-Due-to-Fire-Hazard |
| 2025-05-08 | 25254 | AC power adaptor | 37,400 | https://www.cpsc.gov/Recalls/2025/Yamaha-Corporation-of-America-Recalls-Power-Adaptors-for-Digital-Pianos-and-Music-Workstations-Due-to-Burn-and-Fire-Hazards |
| 2025-04-03 | 25204 | Decorative LED light | 29,000 | https://www.cpsc.gov/Recalls/2025/Five-Below-Recalls-Room2Room-LED-Iridescent-Bear-Lights-Due-to-Fire-and-Burn-Hazards |
| 2025-02-27 | 25159 | Solar combiner cable | 530 | https://www.cpsc.gov/Recalls/2025/Goal-Zero-Recalls-Solar-Series-Combiner-Cables-for-Solar-Panels-Due-to-Fire-Hazard |
| 2025-02-13 | 25132 | Rechargeable portable lamp | 1,280 | https://www.cpsc.gov/Recalls/2025/Rechargeable-Portable-Lamps-with-Lithium-Ion-Batteries-Recalled-Due-to-Fire-and-Burn-Hazards-Imported-by-BlockBlueLight |
Selected by ECW from 159 recalls whose title names a fire hazard, out of 910 CPSC recalls in the period. Product types only; see each notice for the firm and remedy.
Source: [12][13][14][15] U.S. Consumer Product Safety Commission (SaferProducts.gov); U.S. Consumer Product Safety Commission; U.S. Consumer Product Safety Commission; U.S. Consumer Product Safety Commission
The two largest were high bay LED light fixtures, the kind used in high-ceiling buildings such as warehouses according to one of the notices: about 186,520 units recalled on February 26, 2026 after one report of a fixture catching fire, and about 42,000 units recalled on July 2, 2026 after nine reports of fixtures catching fire. Two power strip recalls (December 18, 2025 and March 26, 2026) cited a lack of supplementary overcurrent protection.
What these electrical fire numbers cannot tell you
All three publishers build on the same voluntary incident reports, use different definitions and leave a large share of causes undetermined.
- Undetermined causes: USFA attributed 560 residential fire deaths in 2023 to fires with cause under investigation, more than the 305 attributed to electrical malfunction. Some of those deaths may involve electrical faults.
- Unreported fires: all three datasets cover fires attended by fire departments. Small fires handled by occupants are not counted.
- Voluntary reporting: 20,945 fire departments reported 2025 incidents to NFIRS as of January 5, 2026. National estimates scale these reports using the NFPA fire department survey.
- System change: the legacy NFIRS platform was sunset on January 1, 2026 and replaced by NERIS (Virginia Department of Fire Programs). Series breaks are likely when estimates move to the new system.
- Definitions overlap: the NFPA combined count, the NFPA equipment count and the CPSC counts share many of the same fires and should not be added together.
- Endpoint index vs USFA trend: the ECW index compares 2023 with 2014. USFA's published trend percentages use its own method and can differ, as with nonresidential fires.
- Home age: no national fire series reports electrical fire rates by year built; the AHS measures are self-reported warning signs.
The record in numbers
- US fire departments responded to an estimated annual average of 46,652 home electrical structure fires in 2020 to 2024, which caused 527 civilian deaths, 1,580 injuries and $2.4 billion in direct property damage a year (NFPA, May 2026).[7]
- NFPA estimated 48,757 US home electrical fires in 2024, compared with 41,390 in 2010, an increase of 17.8% (ECW calculation from NFPA figures).[7]
- In 2024, home electrical fires were 14.8% of the 329,500 US home structure fires and caused 20.3% of the 2,920 home fire deaths (ECW calculation from NFPA estimates).[7][8][10]
- USFA estimated 23,700 residential building electrical malfunction fires in the US in 2023, with 305 deaths, 800 injuries and $1.5 billion in dollar loss.[1]
- Electrical malfunction was the fourth leading cause of US residential building fires and the third leading cause of residential fire deaths in 2023 (USFA).[3][4]
- Across 2014 to 2023, electrical malfunction fires were 6.6% of US residential building fires but 9.4% of residential fire deaths (ECW calculation from USFA estimates).[1][2]
- US residential electrical malfunction fires caused 10.6 deaths and 35.9 injuries per 1,000 fires in 2014 to 2023, against 7.5 deaths and 30.9 injuries per 1,000 for all residential building fires (ECW calculation).[1][2]
- The average US residential electrical malfunction fire caused $63,359 in dollar loss in 2023, 1.94 times the $32,694 average for all residential building fires (ECW calculation, nominal dollars).[1][2]
- Installed wiring was involved in 8,200 unintentional US residential fires a year in 2021 to 2023, 44.3% of the 18,500 fires involving electrical distribution equipment (CPSC Table 4a).[11]
- Cords and plugs were involved in 1,700 US residential fires a year in 2021 to 2023 and 50 deaths, or 29.4 deaths per 1,000 fires, the highest rate among electrical distribution items (ECW calculation from CPSC).[11]
- Between midnight and 8 a.m., US home electrical fires accounted for 22% of fires but 52% of civilian deaths in 2020 to 2024 (NFPA).[7]
- December, January and February together accounted for 28% of US home electrical fires and 39% of the deaths in 2020 to 2024 (NFPA).[7]
- In 2023, 9.1% of occupied US homes built before 1960 reported a blown fuse or tripped breaker in the prior three months, against 6.2% of homes built 2000 to 2009 (ECW tabulation of the American Housing Survey).[20]
- Of 159 CPSC recalls naming a fire hazard between January 1, 2025 and October 26, 2026, 11 (6.9%) involved electrical distribution, wiring or lighting products and 33 (20.8%) involved batteries, chargers, power banks, e-bikes or scooters (ECW classification).[12]
Rates we calculated
Electrical share of residential fires and fire deaths, by year
FormulaUSFA electrical malfunction fires (deaths) / all residential building fires (deaths) x 100
Inputs: fact sheet rows 1 to 80 (derived d1_2014 to d2_2023) (fact sheet rows)
Result: Fires: 6.3% (2014) to 6.9% (2023); deaths: 11.8% (2014) to 10.6% (2023); pooled 6.6% of fires and 9.4% of deaths
Electrical fires claim a larger share of deaths than of fires in every year from 2014 to 2023.
Limitations: USFA assigns one cause per fire; electrical deaths swing widely year to year.
Deaths and injuries per 1,000 fires, electrical vs all residential
Formuladeaths (injuries) / fires x 1,000
Inputs: fact sheet rows 1 to 80 (derived d3, d4, d7_dpk, d7_ipk) (fact sheet rows)
Result: 10.6 vs 7.5 deaths per 1,000 fires; 35.9 vs 30.9 injuries per 1,000 fires (2014 to 2023 pooled); ratio 1.42
An electrical malfunction fire is about 1.42 times as likely to kill as the average residential fire.
Limitations: The all-residential base includes many small confined cooking fires, which lowers its rate.
Trend index, 2014 = 100
Formulafires(year) / fires(2014) x 100
Inputs: fact sheet rows 1 to 100 (derived d5_2014 to d5_2023) (fact sheet rows)
Result: Electrical 99.2 vs all residential 90.8 in 2023
Electrical fires did not share in the decline of other residential fires.
Limitations: Endpoint index; USFA's published trend method differs.
Definition spread
FormulaNFPA combined count / USFA malfunction count; CPSC distribution / NFPA combined
Inputs: derived d9_def_ratio, d9_cpsc_share (fact sheet rows)
Result: 1.97 times; 39.4%
Quoted electrical fire totals differ mainly because of definition, not data error.
Limitations: Periods differ by one to three years.
NFPA electrical share of home fires and deaths, 2024
Formula48,757 / 329,500; 594 / 2,920
Inputs: derived d8_share24_f, d8_share24_d (fact sheet rows)
Result: 14.8% of home fires; 20.3% of home fire deaths; 12.2 vs 8.9 deaths per 1,000
Under the broad NFPA definition, about one home fire death in five involves an electrical fire.
Limitations: Combines two NFPA reports with different release dates.
Item shares and death rates within electrical distribution fires
Formulaitem fires / 18,500; item deaths / item fires x 1,000
Inputs: derived d10_wire_share to d10_res_dpk (fact sheet rows)
Result: Installed wiring 44.3% of fires; cords and plugs 29.4 deaths per 1,000 fires
Wiring dominates incidence; cords and plugs are the deadliest per fire.
Limitations: CPSC rounds deaths to the nearest 10.
Electrical warning signs by home age
Formulaweighted share of occupied homes with blown fuse in last 3 months, by year built
Inputs: derived d12_ahs_ratio, d12_ahs_wire_ratio; table t5 (fact sheet rows)
Result: 9.1% (before 1960) vs 6.2% (2000 to 2009), ratio 1.47; exposed wiring ratio 1.84
Older homes report more electrical warning signs; this supports, but does not prove, the USFA statement about older homes.
Limitations: Self-reported survey items, not fires; sampling error not computed.
What people search for
What is the most common cause of electrical fires?
Installed wiring is the item most often involved. CPSC estimates 8,200 unintentional residential fires a year involving installed wiring in 2021 to 2023, 44.3% of fires involving electrical distribution equipment. NFPA reports that cable wire or cable insulation was the item first ignited in 36% of home electrical fires in 2020 to 2024 and that arcing was the heat source in 64%.
How many house fires are caused by electrical problems?
It depends on the definition. NFPA counts 46,652 home electrical fires a year in 2020 to 2024, or 14.8% of home structure fires in 2024. USFA's narrower electrical malfunction cause covered 23,700 residential building fires in 2023, about 6.9% of residential fires.
What does an electrical fire smell like?
NFPA's electrical safety tip sheet lists a burning or rubbery smell coming from an appliance among the warning signs, alongside warm or discolored outlets, flickering lights, sparks and frequent tripped breakers, and advises calling a qualified electrician or landlord. This report does not give diagnostic advice; see how to hire a licensed electrician.
Are older homes more at risk of electrical fires?
USFA states the risk may be particularly true for homes more than 40 years old but does not publish a rate. In 2023 American Housing Survey data, 9.1% of homes built before 1960 reported a blown fuse or tripped breaker in three months against 6.2% of homes built 2000 to 2009 (ECW tabulation). That is a warning-sign measure, not a fire rate.
In short
- NFPA counts an annual average of 46,652 US home electrical fires in 2020 to 2024, with 527 civilian deaths, 1,580 injuries and $2.4 billion in damage per year.
- Published US counts range from 18,400 to 56,900 fires a year because CPSC, NFPA and USFA define an electrical fire differently; the NFPA combined count is 1.97 times the USFA electrical malfunction count.
- Under the USFA definition, electrical malfunction caused 6.6% of residential building fires but 9.4% of residential fire deaths over 2014 to 2023 (ECW calculation).
- With 2014 set to 100, residential electrical malfunction fires stood at 99.2 in 2023 while all residential fires fell to 90.8, so electrical fires are a growing share of a shrinking total.
- Electrical malfunction fires caused 10.6 deaths per 1,000 fires against 7.5 for all residential fires over 2014 to 2023, a ratio of 1.42.
- Installed wiring accounts for 44.3% of fires involving electrical distribution equipment (CPSC, 2021 to 2023); cords and plugs cause the most deaths per fire at 29.4 per 1,000.
- Fires between midnight and 8 a.m. are 22% of home electrical fires but 52% of the deaths (NFPA, 2020 to 2024).
- CPSC issued 11 fire-hazard recalls of electrical distribution, wiring and lighting products between January 1, 2025 and October 26, 2026, covering about 322,393 units.
Common questions
How many electrical fires happen in the US each year?
NFPA estimates an annual average of 46,652 home electrical fires in 2020 to 2024. USFA counts 23,700 residential building electrical malfunction fires in 2023, plus 7,400 nonresidential building electrical malfunction fires.
How many people die in electrical fires each year?
NFPA estimates 527 civilian deaths a year in home electrical fires in 2020 to 2024. USFA attributes 305 residential fire deaths to electrical malfunction in 2023.
What percentage of home fires are electrical?
Under NFPA's combined definition, 14.8% of US home structure fires in 2024. Under USFA's electrical malfunction cause, 6.9% of residential building fires in 2023.
Are electrical fires more deadly than other house fires?
Yes. From 2014 to 2023, residential electrical malfunction fires caused 10.6 deaths per 1,000 fires against 7.5 for all residential fires (ECW calculation from USFA).
How much property damage do electrical fires cause?
NFPA puts direct property damage from home electrical fires at $2.4 billion a year in 2020 to 2024 (2024 dollars). USFA estimates $1.5 billion for residential electrical malfunction fires in 2023.
Are electrical fires increasing?
NFPA's count rose from 41,390 in 2010 to 48,757 in 2024. USFA's residential count was 23,900 in 2014 and 23,700 in 2023, level while all residential fires fell.
When do most electrical fires happen?
December, January and February account for 28% of home electrical fires and 39% of deaths. Fires from midnight to 8 a.m. are 22% of fires but 52% of deaths (NFPA, 2020 to 2024).
Where in the house do electrical fires start?
NFPA reports kitchens or cooking areas (15%), bedrooms (12%) and attics or ceiling assemblies (9%) as the leading areas of origin in 2020 to 2024.
Do extension cords and power strips cause many fires?
CPSC estimates cords and plugs were involved in 1,700 residential fires and 50 deaths a year in 2021 to 2023. CPSC recalled two power strip models for fire risk in December 2025 and March 2026.
What is the newest source of US electrical fire data?
CPSC's 2021 to 2023 Residential Fire Loss Estimates (October 2026) and NFPA's Home Electrical Fires (May 2026), which covers 2020 to 2024.
Get the data
Every table in this report is available as a CSV under CC BY 4.0. The fact sheet lists each value with its source URL and access date.
- derived_metrics.csv (CSV)
- fact_sheet.csv (CSV)
- Residential building electrical malfunction fires and their share of all residential fires, US, 2014 to 2023 (CSV)
- Deaths, injuries and dollar loss per fire: electrical malfunction fires vs all residential building fires, US, 2014 to 2023 (CSV)
- Six published counts of US electrical fires and what each one measures (CSV)
- Unintentional residential fires by electrical distribution item involved in ignition, US, 2021 to 2023 annual average (CSV)
- Occupied US homes reporting electrical warning signs, by year built, 2023 (CSV)
- CPSC fire-hazard recalls of electrical distribution, wiring and lighting products, January 1, 2025 to October 26, 2026 (CSV)
Cite this report
The figures to cite first
- 46,652 home electrical fires and 527 deaths a year, 2020 to 2024 (NFPA, May 2026).[7]
- 10.6 vs 7.5 deaths per 1,000 fires, electrical vs all residential, 2014 to 2023 (ECW from USFA).[1][2]
- Installed wiring: 8,200 fires a year, 44.3% of electrical distribution fires, 2021 to 2023 (CPSC).[11]
Quotable figures
- US fire departments responded to an annual average of 46,652 home electrical fires in 2020 to 2024, which caused 527 deaths a year (NFPA).[7]
- Residential electrical malfunction fires caused 10.6 deaths per 1,000 fires in 2014 to 2023, against 7.5 for all residential fires (ECW from USFA).[1][2]
- Electrical malfunction caused 6.6% of US residential building fires but 9.4% of residential fire deaths in 2014 to 2023 (ECW from USFA).[1][2]
- Fires between midnight and 8 a.m. were 22% of US home electrical fires but 52% of the deaths in 2020 to 2024 (NFPA).[7]
- Installed wiring was involved in 8,200 US residential fires a year in 2021 to 2023, 44.3% of electrical distribution fires (CPSC).[11]
- Published US electrical fire counts range from 18,400 to 56,900 a year depending on the definition (CPSC, NFPA, USFA).[1][7][9][11]
Summary for editors
US electrical fire counts differ by a factor of three because publishers measure different things, an Electrical Contractors and Wiring Data Desk review of USFA, NFPA and CPSC data finds. NFPA's May 2026 report puts home electrical fires at 46,652 a year in 2020 to 2024, with 527 deaths and $2.4 billion in damage. USFA's narrower electrical malfunction cause counted 23,700 residential fires and 305 deaths in 2023, and CPSC counts 18,400 unintentional fires a year involving electrical distribution equipment. Across 2014 to 2023, USFA data show electrical malfunction fires were 6.6% of residential fires but 9.4% of deaths, and caused 10.6 deaths per 1,000 fires against 7.5 for all residential fires. Electrical fires held level while other residential fires fell, leaving the 2023 index at 99.2 against 90.8. Installed wiring is the largest single item, at 8,200 fires a year. Fires from midnight to 8 a.m. cause 52% of home electrical fire deaths. The data and tables are free to reuse under CC BY 4.0.
Headlines the data supports
- Electrical fires kill 1.42 times as many people per fire as the average home fire
- US electrical fire counts range from 18,400 to 56,900 a year, depending on who is counting
- Home electrical fires reach 48,757 in 2024 as other home fires decline
- More than half of home electrical fire deaths happen between midnight and 8 a.m.
- Installed wiring, not cords, starts the most US electrical fires
Citation
Electrical Contractors and Wiring. (2026). Electrical Fire Statistics: How Many US Fires, What Starts Them and the Harm They Do. Retrieved from https://electricalcontractorsandwiring.com/data/electrical-fire-statistics/
Reuse
Data and tables are licensed CC BY 4.0. Attribution: “Source: Electrical Contractors and Wiring, Electrical Fire Statistics: How Many US Fires, What Starts Them and the Harm They Do” with a link to this page.
How we built this report
Selection: the report uses national estimates from the three US bodies that publish electrical fire counts: the U.S. Fire Administration (NFIRS-based estimates by cause, 2014 to 2023), NFPA Research (Home Electrical Fires, May 2026, and related reports) and the U.S. Consumer Product Safety Commission (2021 to 2023 Residential Fire Loss Estimates, October 2026). All three rely on fire department reports to NFIRS scaled with the NFPA fire department experience survey. ESFI is included as a Tier 2 trade body only to show an undated figure in circulation.
Inclusion and exclusion: only fires attended by US fire departments are covered. CPSC figures exclude intentional fires. USFA residential buildings include hotels, dormitories and care facilities; NFPA homes include one- and two-family homes, manufactured homes and apartments. NFPA tables are copyrighted, so the report cites NFPA headline figures and a small number of single-year values and links to the report rather than reproducing its tables.
Conflicting numbers: no single figure is treated as the correct count. Each count is reported with its publisher, definition, scope and period in Table t3_definitions. The NFPA $2.4 billion headline equals the average of its inflation-adjusted series (2024 dollars); its nominal average is $2,234 million. CPSC gives 18,400 electrical distribution fires in its executive summary and Table 1a and 18,500 in Table 4a; shares by item use the Table 4a total.
Derived metrics: shares, rates per 1,000 fires, dollar loss per fire and the 2014 = 100 index are computed in scripts/build_data.py from the USFA series transcribed into fact_sheet.csv; every formula and input row is listed in derived_metrics.csv. Recall counts come from scripts/cpsc_recalls.py using the keyless SaferProducts.gov API with a manual product review. AHS 2023 shares are weighted with the public use file WEIGHT variable for occupied interviews in scripts/ahs_electrical_by_age.py; the national blown-fuse share matches the Census published verification estimate of 10,429 thousand homes.
Limitations: USFA cause estimates end with 2023 data and the NFIRS platform was replaced by NERIS on January 1, 2026, so future series may break. Many fire deaths have undetermined causes. Item-level death counts are small and rounded. The AHS measures are self-reported warning signs, not fires, and sampling error is not shown.
Last update: 2026-10-26. Sources were opened on that date; copies are saved in the report's raw folder.
This report presents published data with its limitations. It is not legal, financial or investment advice.
Sources by tier
Tier 1: primary and official sources (22)
- [1] U.S. Fire Administration (FEMA). Residential Building Electrical Malfunction Fire Trends (2014-2023). 2014 to 2023 (page last reviewed Feb. 14, 2025). Accessed 2026-10-26.
- [2] U.S. Fire Administration (FEMA). Residential Fire Estimate Summaries (2014-2023). 2014 to 2023 (page last reviewed Feb. 14, 2025). Accessed 2026-10-26.
- [3] U.S. Fire Administration (FEMA). Residential Building Fire Causes (2014-2023). 2014 to 2023. Accessed 2026-10-26.
- [4] U.S. Fire Administration (FEMA). Residential Building Fire Death Causes (2014-2023). 2014 to 2023. Accessed 2026-10-26.
- [5] U.S. Fire Administration (FEMA). Nonresidential Building Electrical Malfunction Fire Trends (2014-2023). 2014 to 2023. Accessed 2026-10-26.
- [6] U.S. Fire Administration (FEMA). Topical Fire Report Series Vol. 19, Issue 8: Residential Building Electrical Fires (2014-2016), December 2018. 2014 to 2016 (NFIRS 5.0). Accessed 2026-10-26.
- [7] National Fire Protection Association (NFPA Research). Home Electrical Fires, Tucker McGree, May 2026. 2020 to 2024 annual averages; 2010 to 2024 trend. Accessed 2026-10-26.
- [8] National Fire Protection Association (NFPA Research). Home Electrical Fires: Supporting Tables, May 2026. 2010 to 2024. Accessed 2026-10-26.
- [9] National Fire Protection Association (NFPA Research). Home Structure Fires, Shelby Hall and Tucker McGree, August 2025. 2019 to 2023 annual averages. Accessed 2026-10-26.
- [10] National Fire Protection Association (NFPA Research). Fire Loss in the United States During 2024, Shelby Hall, November 2025. 2024. Accessed 2026-10-26.
- [11] U.S. Consumer Product Safety Commission. 2021 to 2023 Residential Fire Loss Estimates, David Miller, October 2026. 2021 to 2023 (unintentional residential structure fires). Accessed 2026-10-26.
- [12] U.S. Consumer Product Safety Commission (SaferProducts.gov). CPSC Recalls REST API, recalls dated 2025-01-01 to 2026-10-26. January 1, 2025 to October 26, 2026. Accessed 2026-10-26.
- [13] U.S. Consumer Product Safety Commission. Recall 26-278: High Bay Linear LED Light Fixtures Recalled Due to Fire Hazard (February 26, 2026). Recall dated 2026-02-26. Accessed 2026-10-26.
- [14] U.S. Consumer Product Safety Commission. Recall 26-599: Metalux Optimized High Bay LED Light Fixtures Recalled Due to Fire Hazard (July 2, 2026). Recall dated 2026-07-02. Accessed 2026-10-26.
- [15] U.S. Consumer Product Safety Commission. Recall 26-346: Power Strips Recalled Due to Risk of Serious Injury or Death from Fire (March 26, 2026). Recall dated 2026-03-26. Accessed 2026-10-26.
- [16] U.S. Fire Administration (FEMA). NERIS FAQ: Basics, Overview and Transition. Current page. Accessed 2026-10-26.
- [17] Virginia Department of Fire Programs. National Emergency Response Information System (NERIS): The NFIRS to NERIS Transition. Current page. Accessed 2026-10-26.
- [18] U.S. Fire Administration (FEMA). National Fire Incident Reporting System (NFIRS): reporting participation 2025. 2025 incidents, data as of Jan. 5, 2026. Accessed 2026-10-26.
- [19] NFPA Public Education Division (copy published by the Kentucky Division of Fire Prevention). Electrical Safety tip sheet. Tip sheet dated 2016. Accessed 2026-10-26.
- [20] U.S. Census Bureau and HUD. American Housing Survey 2023, National Public Use File v1.1 (household.csv). 2023 survey. Accessed 2026-10-26.
- [21] U.S. Census Bureau. 2023 AHS Definitions (blown fuses, exposed wiring). 2023 survey. Accessed 2026-10-26.
- [22] U.S. Fire Administration (FEMA). Nonresidential Fire Estimate Summaries (2014-2023). 2014 to 2023. Accessed 2026-10-26.
Tier 2: trade bodies, market research, company data (1)
- [23] Electrical Safety Foundation International (ESFI). Home Electrical Fires (Internet Archive copy captured 2026-10-02; live page blocked automated access). Undated figures. Accessed 2026-10-26.