Heat Pump Sales in the US: AHRI Shipments vs Gas Furnaces, 2010 to 2026
- Data
- AHRI monthly statistical releases (U.S. manufacturers' shipments)
- Period
- January 2010 to August 2026 (annual 2010 to 2025)
- Release used
- 2026-10-09
- Next release
- Second Friday of November 2026 (September 2026 shipments)
- Geography
- United States; states (ACS); census regions (RECS)
- Sources
- 24 (16 official)
Yes. US heat pump sales, measured as AHRI manufacturer shipments, totaled 3,801,992 units in the 12 months to August 2026, against 3,137,654 gas furnaces. Heat pumps fell 11.6% in 2025, the refrigerant switch year, then rose 5.7% in January to August 2026 after the 25C credit ended.
Heat pump sales passed gas furnaces in 2020 and have led every year since 2022
AHRI's monthly series is the industry's national count of heat pump and furnace shipments; it measures units shipped, not units installed. On a calendar-year basis heat pumps first beat gas furnaces in 2020, fell behind in 2021, and have stayed ahead from 2022 to 2025. The lead narrowed in 2025 and widened again in the latest 12 months.
US manufacturers and importers shipped 3,644,596 air-source heat pumps and 3,247,426 gas warm air furnaces in 2025, according to AHRI's December 2025 data. That is 12.2% more heat pumps than gas furnaces.
Heat pumps outshipped gas furnaces in 2020, 2022, 2023, 2024, 2025. In 2021 gas furnaces were ahead, 4,008,894 to 3,916,766 (AHRI December 2021).
In the latest 12 months, September 2025 to August 2026, heat pump shipments were 3,801,992 and gas furnace shipments 3,137,654. Heat pumps were 54.8% of the two categories combined, up from 52.9% in calendar 2025.
US manufacturer shipments per calendar year, 2010 to 2025, units
Source: AHRI December statistical releases 2011 to 2025 (December 2025 Excel), ECW compilation
| Year | Air-source heat pumps | Gas warm air furnaces | Central air conditioners | Heat pump share of HP + gas furnace (%) | Heat pumps minus gas furnaces | Heat pump share of HP + central AC (%) |
|---|---|---|---|---|---|---|
| 2010 | 1,747,920 | 2,453,279 | 3,419,290 | 41.6 | -705,359 | 33.8 |
| 2011 | 1,765,002 | 2,216,160 | 3,744,691 | 44.3 | -451,158 | 32.0 |
| 2012 | 1,697,796 | 2,243,397 | 3,915,869 | 43.1 | -545,601 | 30.2 |
| 2013 | 1,968,632 | 2,601,760 | 4,201,068 | 43.1 | -633,128 | 31.9 |
| 2014 | 2,353,990 | 2,734,713 | 4,499,660 | 46.3 | -380,723 | 34.3 |
| 2015 | 2,269,462 | 2,814,203 | 4,545,855 | 44.6 | -544,741 | 33.3 |
| 2016 | 2,429,867 | 2,942,545 | 4,900,992 | 45.2 | -512,678 | 33.1 |
| 2017 | 2,619,782 | 3,133,768 | 5,185,747 | 45.5 | -513,986 | 33.6 |
| 2018 | 2,940,502 | 3,416,571 | 5,399,760 | 46.3 | -476,069 | 35.3 |
| 2019 | 3,109,840 | 3,441,872 | 5,359,775 | 47.5 | -332,032 | 36.7 |
| 2020 | 3,418,478 | 3,351,176 | 5,910,284 | 50.5 | 67,302 | 36.6 |
| 2021 | 3,916,766 | 4,008,894 | 6,282,285 | 49.4 | -92,128 | 38.4 |
| 2022 | 4,334,479 | 3,872,368 | 6,053,575 | 52.8 | 462,111 | 41.7 |
| 2023 | 3,616,632 | 2,989,516 | 5,040,042 | 54.7 | 627,116 | 41.8 |
| 2024 | 4,122,004 | 3,120,677 | 5,559,766 | 56.9 | 1,001,327 | 42.6 |
| 2025 | 3,644,596 | 3,247,426 | 4,104,933 | 52.9 | 397,170 | 47.0 |
Calendar-year totals from AHRI December year-to-date figures. Each year uses the prior-year column of the following December release where it exists (it carries revisions), otherwise that year's own December release.
Source: [1][3][4][5][6] Air-Conditioning, Heating, and Refrigeration Institute (AHRI); AHRI; AHRI; AHRI; AHRI
Heat pumps / (heat pumps + gas warm air furnaces), US, percent
Source: ECW calculation from AHRI December statistical releases
Shipment: AHRI counts a shipment when a unit changes ownership, usually from manufacturer to distributor, for customers in the 50 states and DC, whether made in the US or imported. A shipment is not an installation, and one home can need more than one heat pump.
The latest month is August 2026: 338,416 heat pumps and 287,710 gas furnaces, per AHRI's release of October 9, 2026. Gas furnace shipments are seasonal and usually rise in the fall, so a single summer month overstates the heat pump lead.
US monthly shipments, January 2024 to August 2026, units. Refrigerant limit January 2025; 25C credit ended after December 2025
Source: AHRI monthly statistical releases, January 2025 to August 2026 (prior-year columns used where available)
| Measure | Sep 2024 to Aug 2025 | Sep 2025 to Aug 2026 | Change (%) |
|---|---|---|---|
| Air-source heat pumps | 4,041,190 | 3,801,992 | -5.9 |
| Gas warm air furnaces | 3,327,435 | 3,137,654 | -5.7 |
| Central air conditioners | 4,924,750 | 4,317,832 | -12.3 |
| Heat pump share of HP + gas furnace (%) | 54.8 | 54.8 |
Sums of monthly AHRI shipments. September to December 2025 values are from those months' own releases and can still be revised.
Show all 200 rows
| Month | Air-source heat pumps | Gas warm air furnaces | Central air conditioners | Heat pump share of HP + gas furnace (%) | AHRI release used |
|---|---|---|---|---|---|
| 2010-01 | 117,226 | 169,024 | 193,849 | 41.0 | 2011-01 |
| 2010-02 | 105,520 | 150,869 | 153,282 | 41.2 | 2011-02 |
| 2010-03 | 162,969 | 186,963 | 298,328 | 46.6 | 2011-03 |
| 2010-04 | 170,655 | 149,791 | 352,452 | 53.3 | 2011-04 |
| 2010-05 | 189,854 | 172,876 | 396,612 | 52.3 | 2011-05 |
| 2010-06 | 243,072 | 229,979 | 565,322 | 51.4 | 2011-06 |
| 2010-07 | 151,696 | 167,113 | 358,871 | 47.6 | 2011-07 |
| 2010-08 | 139,505 | 199,402 | 300,046 | 41.2 | 2011-08 |
| 2010-09 | 131,551 | 280,097 | 252,370 | 32.0 | 2011-09 |
| 2010-10 | 93,458 | 219,677 | 162,370 | 29.8 | 2011-10 |
| 2010-11 | 108,029 | 257,414 | 179,647 | 29.6 | 2011-11 |
| 2010-12 | 134,385 | 270,074 | 206,141 | 33.2 | 2011-12 |
| 2011-01 | 126,611 | 190,798 | 197,416 | 39.9 | 2011-01 |
| 2011-02 | 147,552 | 150,310 | 203,706 | 49.5 | 2011-02 |
| 2011-03 | 177,934 | 164,861 | 349,721 | 51.9 | 2011-03 |
| 2011-04 | 171,593 | 132,717 | 389,655 | 56.4 | 2011-04 |
| 2011-05 | 191,316 | 145,675 | 439,205 | 56.8 | 2011-05 |
| 2011-06 | 251,268 | 197,285 | 643,726 | 56.0 | 2011-06 |
| 2011-07 | 147,542 | 150,193 | 406,485 | 49.6 | 2011-07 |
| 2011-08 | 146,707 | 181,771 | 371,157 | 44.7 | 2011-08 |
| 2011-09 | 130,578 | 258,147 | 273,406 | 33.6 | 2011-09 |
| 2011-10 | 86,555 | 200,470 | 149,048 | 30.2 | 2011-10 |
| 2011-11 | 86,933 | 221,159 | 145,789 | 28.2 | 2011-11 |
| 2011-12 | 98,532 | 222,774 | 173,435 | 30.7 | 2012-12 |
| 2012-01 | 102,319 | 130,598 | 154,367 | 43.9 | 2013-01 |
| 2012-02 | 107,408 | 141,421 | 188,603 | 43.2 | 2013-02 |
| 2012-03 | 171,477 | 162,335 | 395,770 | 51.4 | 2013-03 |
| 2012-04 | 177,060 | 143,113 | 406,873 | 55.3 | 2013-04 |
| 2012-05 | 186,809 | 165,419 | 477,993 | 53.0 | 2013-05 |
| 2012-06 | 223,710 | 202,727 | 633,652 | 52.5 | 2013-06 |
| 2012-07 | 160,639 | 173,259 | 466,312 | 48.1 | 2013-07 |
| 2012-08 | 146,880 | 208,861 | 368,650 | 41.3 | 2013-08 |
| 2012-09 | 115,036 | 230,072 | 240,770 | 33.3 | 2013-09 |
| 2012-10 | 101,013 | 229,459 | 193,665 | 30.6 | 2013-10 |
| 2012-11 | 104,928 | 251,379 | 206,891 | 29.4 | 2013-11 |
| 2012-12 | 100,517 | 204,754 | 182,323 | 32.9 | 2013-12 |
| 2013-01 | 121,684 | 177,125 | 179,492 | 40.7 | 2013-01 |
| 2013-02 | 126,149 | 165,114 | 231,488 | 43.3 | 2013-02 |
| 2013-03 | 191,826 | 199,496 | 378,608 | 49.0 | 2013-03 |
| 2013-04 | 206,003 | 189,938 | 426,184 | 52.0 | 2013-04 |
| 2013-05 | 220,895 | 193,328 | 532,542 | 53.3 | 2013-05 |
| 2013-06 | 260,860 | 240,777 | 662,207 | 52.0 | 2013-06 |
| 2013-07 | 199,690 | 202,519 | 522,289 | 49.6 | 2013-07 |
| 2013-08 | 153,095 | 215,129 | 347,718 | 41.6 | 2013-08 |
| 2013-09 | 132,872 | 245,656 | 283,307 | 35.1 | 2013-09 |
| 2013-10 | 119,773 | 264,807 | 243,692 | 31.1 | 2013-10 |
| 2013-11 | 116,128 | 267,433 | 207,057 | 30.3 | 2013-11 |
| 2013-12 | 119,657 | 240,438 | 186,484 | 33.2 | 2014-12 |
| 2014-01 | 155,520 | 209,667 | 215,062 | 42.6 | 2015-01 |
| 2014-02 | 155,317 | 181,122 | 241,546 | 46.2 | 2015-02 |
| 2014-03 | 223,354 | 209,678 | 415,218 | 51.6 | 2015-03 |
| 2014-04 | 215,326 | 182,884 | 433,078 | 54.1 | 2015-04 |
| 2014-05 | 265,129 | 210,208 | 554,348 | 55.8 | 2015-05 |
| 2014-06 | 283,942 | 236,962 | 673,296 | 54.5 | 2015-06 |
| 2014-07 | 226,429 | 195,905 | 483,850 | 53.6 | 2015-07 |
| 2014-08 | 169,947 | 205,324 | 348,703 | 45.3 | 2015-08 |
| 2014-09 | 191,485 | 286,429 | 348,143 | 40.1 | 2015-09 |
| 2014-10 | 153,119 | 285,148 | 280,524 | 34.9 | 2015-10 |
| 2014-11 | 130,956 | 265,299 | 227,523 | 33.0 | 2015-11 |
| 2014-12 | 183,466 | 266,087 | 278,369 | 40.8 | 2015-12 |
| 2015-01 | 191,123 | 194,057 | 288,361 | 49.6 | 2015-01 |
| 2015-02 | 180,447 | 177,007 | 295,479 | 50.5 | 2015-02 |
| 2015-03 | 238,671 | 227,423 | 437,339 | 51.2 | 2015-03 |
| 2015-04 | 217,288 | 182,201 | 456,072 | 54.4 | 2015-04 |
| 2015-05 | 237,923 | 183,407 | 499,250 | 56.5 | 2015-05 |
| 2015-06 | 266,613 | 257,321 | 611,900 | 50.9 | 2015-06 |
| 2015-07 | 219,693 | 221,563 | 506,914 | 49.8 | 2015-07 |
| 2015-08 | 171,454 | 269,279 | 393,798 | 38.9 | 2015-08 |
| 2015-09 | 152,597 | 317,741 | 335,867 | 32.4 | 2015-09 |
| 2015-10 | 139,445 | 280,615 | 257,477 | 33.2 | 2015-10 |
| 2015-11 | 116,831 | 248,953 | 218,076 | 31.9 | 2015-11 |
| 2015-12 | 137,080 | 254,636 | 245,322 | 35.0 | 2016-12 |
| 2016-01 | 166,486 | 195,348 | 257,616 | 46.0 | 2017-01 |
| 2016-02 | 162,039 | 193,299 | 275,381 | 45.6 | 2017-02 |
| 2016-03 | 252,418 | 228,343 | 467,666 | 52.5 | 2017-03 |
| 2016-04 | 195,799 | 185,253 | 441,461 | 51.4 | 2017-04 |
| 2016-05 | 237,684 | 211,950 | 510,552 | 52.9 | 2017-05 |
| 2016-06 | 293,345 | 274,953 | 729,018 | 51.6 | 2017-06 |
| 2016-07 | 234,134 | 230,486 | 551,121 | 50.4 | 2017-07 |
| 2016-08 | 214,778 | 273,136 | 477,436 | 44.0 | 2017-08 |
| 2016-09 | 200,005 | 314,809 | 383,526 | 38.8 | 2017-09 |
| 2016-10 | 153,969 | 264,440 | 271,913 | 36.8 | 2017-10 |
| 2016-11 | 155,262 | 267,860 | 253,895 | 36.7 | 2017-11 |
| 2016-12 | 163,948 | 302,668 | 281,407 | 35.1 | 2017-12 |
| 2017-01 | 191,108 | 231,997 | 271,954 | 45.2 | 2017-01 |
| 2017-02 | 175,718 | 184,013 | 292,446 | 48.8 | 2017-02 |
| 2017-03 | 263,194 | 242,530 | 517,518 | 52.0 | 2017-03 |
| 2017-04 | 226,205 | 211,293 | 467,884 | 51.7 | 2017-04 |
| 2017-05 | 278,214 | 245,431 | 622,245 | 53.1 | 2017-05 |
| 2017-06 | 319,612 | 301,945 | 760,247 | 51.4 | 2017-06 |
| 2017-07 | 241,472 | 237,373 | 588,703 | 50.4 | 2017-07 |
| 2017-08 | 221,866 | 283,960 | 432,446 | 43.9 | 2017-08 |
| 2017-09 | 198,512 | 338,347 | 377,408 | 37.0 | 2017-09 |
| 2017-10 | 162,744 | 261,794 | 292,559 | 38.3 | 2017-10 |
| 2017-11 | 161,826 | 284,397 | 269,842 | 36.3 | 2017-11 |
| 2017-12 | 179,513 | 310,688 | 293,983 | 36.6 | 2018-12 |
| 2018-01 | 215,814 | 262,744 | 266,857 | 45.1 | 2019-01 |
| 2018-02 | 208,414 | 208,815 | 307,522 | 50.0 | 2019-02 |
| 2018-03 | 300,472 | 268,582 | 528,041 | 52.8 | 2019-03 |
| 2018-04 | 243,300 | 230,560 | 489,558 | 51.3 | 2019-04 |
| 2018-05 | 298,236 | 277,258 | 673,010 | 51.8 | 2019-05 |
| 2018-06 | 336,754 | 334,382 | 783,705 | 50.2 | 2019-06 |
| 2018-07 | 293,404 | 263,832 | 597,786 | 52.7 | 2019-07 |
| 2018-08 | 247,994 | 317,745 | 494,177 | 43.8 | 2019-08 |
| 2018-09 | 216,003 | 325,102 | 379,698 | 39.9 | 2019-09 |
| 2018-10 | 195,471 | 315,463 | 311,728 | 38.3 | 2019-10 |
| 2018-11 | 175,813 | 311,635 | 274,586 | 36.1 | 2019-11 |
| 2018-12 | 199,666 | 300,453 | 292,320 | 39.9 | 2019-12 |
| 2019-01 | 235,490 | 232,321 | 283,498 | 50.3 | 2020-01 |
| 2019-02 | 213,233 | 246,778 | 315,183 | 46.4 | 2020-02 |
| 2019-03 | 298,252 | 351,908 | 515,353 | 45.9 | 2020-03 |
| 2019-04 | 254,161 | 272,138 | 488,907 | 48.3 | 2020-04 |
| 2019-05 | 346,223 | 290,143 | 659,423 | 54.4 | 2020-05 |
| 2019-06 | 355,508 | 353,700 | 716,424 | 50.1 | 2020-06 |
| 2019-07 | 295,190 | 238,979 | 613,974 | 55.3 | 2020-07 |
| 2019-08 | 280,671 | 305,850 | 499,252 | 47.9 | 2020-08 |
| 2019-09 | 233,026 | 286,870 | 380,581 | 44.8 | 2020-09 |
| 2019-10 | 200,978 | 290,916 | 315,498 | 40.9 | 2020-10 |
| 2019-11 | 192,008 | 284,670 | 267,994 | 40.3 | 2020-11 |
| 2019-12 | 205,100 | 287,599 | 303,688 | 41.6 | 2020-12 |
| 2020-01 | 231,868 | 227,706 | 308,311 | 50.5 | 2021-01 |
| 2020-02 | 233,156 | 202,583 | 325,697 | 53.5 | 2021-02 |
| 2020-03 | 304,947 | 244,961 | 546,992 | 55.5 | 2021-03 |
| 2020-04 | 235,996 | 156,483 | 398,040 | 60.1 | 2021-04 |
| 2020-05 | 255,191 | 215,313 | 522,624 | 54.2 | 2021-05 |
| 2020-06 | 358,616 | 321,509 | 754,433 | 52.7 | 2021-06 |
| 2020-07 | 335,041 | 288,630 | 675,373 | 53.7 | 2021-07 |
| 2020-08 | 310,773 | 321,537 | 639,349 | 49.1 | 2021-08 |
| 2020-09 | 328,981 | 351,087 | 573,565 | 48.4 | 2021-09 |
| 2020-10 | 333,682 | 353,858 | 497,986 | 48.5 | 2021-10 |
| 2020-11 | 247,975 | 314,418 | 346,023 | 44.1 | 2021-11 |
| 2020-12 | 242,252 | 353,091 | 321,891 | 40.7 | 2021-12 |
| 2021-01 | 277,095 | 355,097 | 408,831 | 43.8 | 2021-01 |
| 2021-02 | 274,727 | 303,654 | 363,045 | 47.5 | 2021-02 |
| 2021-03 | 348,385 | 372,985 | 576,646 | 48.3 | 2021-03 |
| 2021-04 | 381,078 | 343,451 | 602,723 | 52.6 | 2021-04 |
| 2021-05 | 380,207 | 336,566 | 642,306 | 53.0 | 2021-05 |
| 2021-06 | 392,558 | 324,473 | 682,825 | 54.7 | 2021-06 |
| 2021-07 | 336,463 | 310,614 | 615,860 | 52.0 | 2021-07 |
| 2021-08 | 340,965 | 333,032 | 588,595 | 50.6 | 2021-08 |
| 2021-09 | 320,992 | 353,047 | 578,553 | 47.6 | 2021-09 |
| 2021-10 | 304,570 | 327,329 | 486,751 | 48.2 | 2021-10 |
| 2021-11 | 282,113 | 325,641 | 383,954 | 46.4 | 2021-11 |
| 2021-12 | 277,613 | 323,005 | 352,196 | 46.2 | 2022-12 |
| 2022-01 | 325,443 | 306,853 | 431,835 | 51.5 | 2023-01 |
| 2022-02 | 306,519 | 295,777 | 424,293 | 50.9 | 2023-02 |
| 2022-03 | 362,730 | 361,910 | 583,253 | 50.1 | 2023-03 |
| 2022-04 | 347,573 | 320,976 | 592,889 | 52.0 | 2023-04 |
| 2022-05 | 401,269 | 323,171 | 622,397 | 55.4 | 2023-05 |
| 2022-06 | 460,710 | 396,271 | 683,649 | 53.8 | 2023-06 |
| 2022-07 | 362,063 | 299,823 | 538,146 | 54.7 | 2023-07 |
| 2022-08 | 401,237 | 363,370 | 559,137 | 52.5 | 2023-08 |
| 2022-09 | 407,464 | 352,635 | 504,064 | 53.6 | 2023-09 |
| 2022-10 | 363,830 | 316,814 | 396,208 | 53.5 | 2023-10 |
| 2022-11 | 298,634 | 286,046 | 398,510 | 51.1 | 2023-11 |
| 2022-12 | 297,007 | 248,722 | 319,194 | 54.4 | 2023-12 |
| 2023-01 | 281,701 | 256,356 | 327,455 | 52.4 | 2024-01 |
| 2023-02 | 307,042 | 231,944 | 342,814 | 57.0 | 2024-02 |
| 2023-03 | 381,373 | 268,309 | 496,539 | 58.7 | 2024-03 |
| 2023-04 | 293,074 | 249,715 | 418,975 | 54.0 | 2024-04 |
| 2023-05 | 380,142 | 248,584 | 527,908 | 60.5 | 2024-05 |
| 2023-06 | 379,895 | 262,890 | 598,766 | 59.1 | 2024-06 |
| 2023-07 | 326,771 | 212,490 | 529,700 | 60.6 | 2024-07 |
| 2023-08 | 336,092 | 281,915 | 541,108 | 54.4 | 2024-08 |
| 2023-09 | 301,971 | 285,774 | 461,330 | 51.4 | 2024-09 |
| 2023-10 | 225,834 | 232,252 | 306,735 | 49.3 | 2024-10 |
| 2023-11 | 205,690 | 226,564 | 250,170 | 47.6 | 2024-11 |
| 2023-12 | 197,047 | 232,723 | 238,542 | 45.8 | 2024-12 |
| 2024-01 | 231,339 | 216,086 | 248,035 | 51.7 | 2025-01 |
| 2024-02 | 284,612 | 214,961 | 372,897 | 57.0 | 2025-02 |
| 2024-03 | 367,973 | 248,582 | 470,653 | 59.7 | 2025-03 |
| 2024-04 | 314,449 | 234,440 | 434,239 | 57.3 | 2025-04 |
| 2024-05 | 365,881 | 245,283 | 545,636 | 59.9 | 2025-05 |
| 2024-06 | 432,916 | 303,885 | 647,901 | 58.8 | 2025-06 |
| 2024-07 | 430,204 | 255,099 | 613,216 | 62.8 | 2025-07 |
| 2024-08 | 404,688 | 291,132 | 571,153 | 58.2 | 2025-08 |
| 2024-09 | 383,659 | 302,746 | 520,197 | 55.9 | 2025-09 |
| 2024-10 | 365,388 | 280,747 | 449,972 | 56.5 | 2025-10 |
| 2024-11 | 315,905 | 260,657 | 391,531 | 54.8 | 2025-11 |
| 2024-12 | 224,990 | 267,059 | 294,336 | 45.7 | 2024-12 |
| 2025-01 | 275,544 | 271,380 | 347,357 | 50.4 | 2026-01 |
| 2025-02 | 293,760 | 259,405 | 342,542 | 53.1 | 2026-02 |
| 2025-03 | 382,470 | 298,639 | 436,291 | 56.2 | 2026-03 |
| 2025-04 | 374,004 | 264,259 | 422,275 | 58.6 | 2026-04 |
| 2025-05 | 387,610 | 283,691 | 474,519 | 57.7 | 2026-05 |
| 2025-06 | 363,499 | 278,043 | 477,270 | 56.7 | 2026-06 |
| 2025-07 | 351,913 | 260,224 | 411,530 | 57.5 | 2026-07 |
| 2025-08 | 322,448 | 300,585 | 356,930 | 51.8 | 2026-08 |
| 2025-09 | 265,689 | 281,001 | 263,291 | 48.6 | 2025-09 |
| 2025-10 | 209,883 | 244,324 | 202,990 | 46.2 | 2025-10 |
| 2025-11 | 198,247 | 238,810 | 181,223 | 45.4 | 2025-11 |
| 2025-12 | 219,529 | 267,065 | 188,715 | 45.1 | 2025-12 |
| 2026-01 | 229,957 | 217,762 | 210,862 | 51.4 | 2026-01 |
| 2026-02 | 310,696 | 244,774 | 328,145 | 55.9 | 2026-02 |
| 2026-03 | 419,917 | 252,982 | 436,757 | 62.4 | 2026-03 |
| 2026-04 | 380,888 | 251,401 | 456,210 | 60.2 | 2026-04 |
| 2026-05 | 396,553 | 265,734 | 523,132 | 59.9 | 2026-05 |
| 2026-06 | 418,538 | 320,281 | 605,033 | 56.6 | 2026-06 |
| 2026-07 | 413,679 | 265,810 | 503,151 | 60.9 | 2026-07 |
| 2026-08 | 338,416 | 287,710 | 418,323 | 54.0 | 2026-08 |
200 months, January 2010 to August 2026, with no gaps. The release column shows which AHRI release supplied each figure (the following year's release of the same month where available, because it carries revisions).
Source: [1][2][3] Air-Conditioning, Heating, and Refrigeration Institute (AHRI); AHRI; AHRI
Heat pumps outshipped central air conditioners for the first time in September 2025
On the cooling side, the heat pump share of heat pump plus central AC shipments rose from 33.8% in 2010 to 47.0% in 2025. In 2025 the AC market fell much harder than heat pumps, and from September 2025 to January 2026 more heat pumps than ACs shipped each month.
Heat pumps were 47.0% of combined US heat pump and central AC shipments in 2025, compared with 33.8% in 2010 and 42.6% in 2024.
In September 2025, AHRI counted 265,689 heat pumps and 263,291 central air conditioners (AHRI September 2025). Heat pumps stayed ahead in October, November and December 2025 and in January 2026; ACs moved back in front in February 2026 (328,145 vs 310,696).
Central AC shipments fell 26.2% in 2025, from 5,559,766 to 4,104,933, while heat pumps fell 11.6%. In January to August 2026 central ACs recovered 6.5% on a year earlier.
Three policy dates line up with the biggest swings in shipments
SEER2 standards in 2023, the AIM Act refrigerant limit in 2025 and the end of the 25C credit after 2025 each coincide with a turn in the series. The timing is clear; the cause is not, because gas furnaces moved too and some distributors stocked older equipment ahead of the 2025 change.
| Date | Policy change | Source | Observed shipment change |
|---|---|---|---|
| 2023-01-01 | DOE SEER2/HSPF2 standards apply to central AC and heat pumps made or imported from this date; split heat pumps 14.3 SEER2 and 7.5 HSPF2 | DOE, 82 FR 1786 | 2023 vs 2022: heat pumps -16.6%, gas furnaces -22.8%, central AC -16.7% |
| 2025-01-01 | EPA bars refrigerants with GWP of 700 or more in new residential AC and heat pump equipment (manufacture, import, and installation of new split systems) | EPA, 88 FR 73098 | 2025 vs 2024: heat pumps -11.6%, gas furnaces +4.1%, central AC -26.2% |
| 2026-01-01 | Installation deadline for split systems built from pre-2025 components under EPA's December 2023 interim rule; first month without the 25C credit | EPA, 91 FR 31284; IRS | January 2026 vs January 2025: heat pumps -16.5%, gas furnaces -19.8% |
| 2026-07-27 | EPA final rule lets pre-2025 residential AC and heat pump inventory continue to be installed | EPA, 91 FR 31284 | August 2026 vs August 2025: heat pumps +5.0%, gas furnaces -4.3% |
Changes are ECW calculations from AHRI shipments. They show what happened after each date, not what each policy caused.
Source: [8][9][11][13][3][4][2] U.S. Environmental Protection Agency, Federal Register; U.S. Environmental Protection Agency, Federal Register; U.S. Department of Energy, Federal Register; Internal Revenue Service; AHRI; AHRI; AHRI
2023, SEER2. DOE's amended standards applied to central ACs and heat pumps made or imported from January 1, 2023, with split heat pumps at 14.3 SEER2 and 7.5 HSPF2 (82 FR 1786; 82 FR 24211). Heat pump shipments fell 16.6% in 2023. Gas furnaces, which the rule does not cover, fell 22.8%, so the standard alone does not explain the drop.
2025, refrigerants. EPA's 2023 technology transitions rule set a 700 GWP limit for new residential and light commercial AC and heat pump systems from January 1, 2025, which pushed equipment from R-410A to A2L refrigerants such as R-454B (GWP 465) and R-32 (GWP 675) (88 FR 73098). Heat pump shipments fell 11.6% in 2025 and were below the prior year in 7 of 12 months.
EPA's 2026 final rule records that A2L equipment reached 90% of the market by the end of the 2025 cooling season, citing HARDI, and that contractors in some regions struggled to get R-454B in service cylinders (91 FR 31284). The same rule, effective July 27, 2026, lets pre-2025 inventory continue to be installed. Canary Media reported that some distributors stocked up on older equipment in 2024 (Canary Media).
2026, no 25C credit. The IRS says the energy efficient home improvement credit, up to $2,000 a year for qualified heat pumps, applied to improvements made through December 31, 2025 (IRS). Credit details and state rebates are tracked on heat pump rebates by state. January 2026 heat pump shipments were -16.5% below January 2025, but January to August 2026 ended 5.7% higher, with gains in 7 of 8 months.
Percent change from the same month a year earlier, US, January 2025 to August 2026
Source: ECW calculation from AHRI monthly statistical releases
| Month | Heat pumps | Heat pumps a year earlier | Heat pump change (%) | Gas furnaces | Gas furnaces a year earlier | Gas furnace change (%) | Central AC change (%) |
|---|---|---|---|---|---|---|---|
| Jan 2025 | 275,544 | 231,339 | +19.1 | 271,380 | 216,086 | +25.6 | +40.0 |
| Feb 2025 | 293,760 | 284,612 | +3.2 | 259,405 | 214,961 | +20.7 | -8.1 |
| Mar 2025 | 382,470 | 367,973 | +3.9 | 298,639 | 248,582 | +20.1 | -7.3 |
| Apr 2025 | 374,004 | 314,449 | +18.9 | 264,259 | 234,440 | +12.7 | -2.8 |
| May 2025 | 387,610 | 365,881 | +5.9 | 283,691 | 245,283 | +15.7 | -13.0 |
| Jun 2025 | 363,499 | 432,916 | -16.0 | 278,043 | 303,885 | -8.5 | -26.3 |
| Jul 2025 | 351,913 | 430,204 | -18.2 | 260,224 | 255,099 | +2.0 | -32.9 |
| Aug 2025 | 322,448 | 404,688 | -20.3 | 300,585 | 291,132 | +3.2 | -37.5 |
| Sep 2025 | 265,689 | 383,659 | -30.7 | 281,001 | 302,746 | -7.2 | -49.4 |
| Oct 2025 | 209,883 | 365,388 | -42.6 | 244,324 | 280,747 | -13.0 | -54.9 |
| Nov 2025 | 198,247 | 315,905 | -37.2 | 238,810 | 260,657 | -8.4 | -53.7 |
| Dec 2025 | 219,529 | 224,990 | -2.4 | 267,065 | 267,059 | +0.0 | -35.9 |
| Jan 2026 | 229,957 | 275,544 | -16.5 | 217,762 | 271,380 | -19.8 | -39.3 |
| Feb 2026 | 310,696 | 293,760 | +5.8 | 244,774 | 259,405 | -5.6 | -4.2 |
| Mar 2026 | 419,917 | 382,470 | +9.8 | 252,982 | 298,639 | -15.3 | +0.1 |
| Apr 2026 | 380,888 | 374,004 | +1.8 | 251,401 | 264,259 | -4.9 | +8.0 |
| May 2026 | 396,553 | 387,610 | +2.3 | 265,734 | 283,691 | -6.3 | +10.2 |
| Jun 2026 | 418,538 | 363,499 | +15.1 | 320,281 | 278,043 | +15.2 | +26.8 |
| Jul 2026 | 413,679 | 351,913 | +17.6 | 265,810 | 260,224 | +2.1 | +22.3 |
| Aug 2026 | 338,416 | 322,448 | +5.0 | 287,710 | 300,585 | -4.3 | +17.2 |
Percent change in units shipped from the same month a year earlier. Prior-year values come from the later release where available.

Electricity heats 41.8% of US homes, from 89.4% in Florida to 11.0% in Vermont
Shipments say what is sold; the housing surveys say what homes use. Electric heat dominates the Southeast and is a small minority in the Northeast and upper Midwest. In 2020 most US heat pump homes were in the South.
The Census Bureau's 2025 ACS counted 56,036,206 of 134,063,422 occupied US homes using electricity as the main heating fuel, or 41.8% (ACS B25040). Utility gas heated 46.9%. Electricity's share was 41.0% in 2021, so it rose 0.8 percentage points in four years.
- Highest electricity share: Florida (89.4%), South Carolina (69.6%), Alabama (67.5%), North Carolina (66.1%), Louisiana (63.4%).
- Lowest electricity share: Vermont (11.0%), Michigan (12.1%), New Hampshire (12.3%), Maine (13.4%), Rhode Island (13.8%).
Percent of occupied housing units, ACS 1-year B25040
Source: U.S. Census Bureau, American Community Survey 2025 1-year, table B25040 (released October 29, 2026)
Show all 51 rows
| Rank | State | Occupied homes | Heated mainly by electricity | Electricity share (%) | Utility gas share (%) |
|---|---|---|---|---|---|
| 1 | Florida | 9,326,796 | 8,336,255 | 89.4 | 6.2 |
| 2 | South Carolina | 2,296,350 | 1,597,787 | 69.6 | 25.3 |
| 3 | Alabama | 2,070,835 | 1,397,345 | 67.5 | 26.3 |
| 4 | North Carolina | 4,539,531 | 2,999,168 | 66.1 | 25.1 |
| 5 | Louisiana | 1,855,847 | 1,176,440 | 63.4 | 33.2 |
| 6 | Tennessee | 2,954,096 | 1,867,077 | 63.2 | 31.3 |
| 7 | Arizona | 3,040,935 | 1,849,028 | 60.8 | 33.5 |
| 8 | Washington | 3,180,129 | 1,928,249 | 60.6 | 32.4 |
| 9 | Texas | 11,607,274 | 6,949,707 | 59.9 | 36.1 |
| 10 | Virginia | 3,480,219 | 2,009,807 | 57.7 | 32.8 |
| 11 | Georgia | 4,269,857 | 2,447,019 | 57.3 | 38.0 |
| 12 | Mississippi | 1,197,317 | 681,887 | 57.0 | 31.3 |
| 13 | Kentucky | 1,885,581 | 1,041,304 | 55.2 | 35.2 |
| 14 | Oregon | 1,745,361 | 959,644 | 55.0 | 36.6 |
| 15 | Arkansas | 1,277,805 | 675,632 | 52.9 | 37.4 |
| 16 | District of Columbia | 333,195 | 171,609 | 51.5 | 45.2 |
| 17 | West Virginia | 747,801 | 361,836 | 48.4 | 39.1 |
| 18 | Maryland | 2,428,843 | 1,070,808 | 44.1 | 44.4 |
| 19 | Hawaii | 500,883 | 213,781 | 42.7 | 3.7 |
| 20 | Oklahoma | 1,616,177 | 663,111 | 41.0 | 51.0 |
| 21 | Missouri | 2,604,619 | 1,030,630 | 39.6 | 49.1 |
| 22 | North Dakota | 352,013 | 137,730 | 39.1 | 43.1 |
| 23 | Delaware | 422,123 | 161,142 | 38.2 | 42.0 |
| 24 | Idaho | 765,200 | 281,029 | 36.7 | 51.3 |
| 25 | Nevada | 1,245,703 | 412,503 | 33.1 | 61.4 |
| 26 | South Dakota | 387,580 | 128,030 | 33.0 | 47.7 |
| 27 | Nebraska | 827,249 | 262,775 | 31.8 | 58.8 |
| 28 | Indiana | 2,816,686 | 884,026 | 31.4 | 58.9 |
| 29 | California | 13,898,622 | 4,196,851 | 30.2 | 61.1 |
| 30 | Kansas | 1,205,638 | 330,681 | 27.4 | 63.4 |
| 31 | Montana | 481,275 | 129,641 | 26.9 | 51.5 |
| 32 | Pennsylvania | 5,405,581 | 1,444,505 | 26.7 | 51.7 |
| 33 | Ohio | 4,957,873 | 1,298,375 | 26.2 | 64.4 |
| 34 | Colorado | 2,483,142 | 611,011 | 24.6 | 68.2 |
| 35 | Iowa | 1,355,504 | 332,262 | 24.5 | 60.7 |
| 36 | New Mexico | 863,010 | 209,295 | 24.3 | 61.9 |
| 37 | Wyoming | 256,608 | 61,391 | 23.9 | 59.5 |
| 38 | Massachusetts | 2,827,794 | 595,521 | 21.1 | 51.6 |
| 39 | Connecticut | 1,456,915 | 293,346 | 20.1 | 36.2 |
| 40 | Minnesota | 2,391,870 | 450,812 | 18.8 | 66.5 |
| 41 | Wisconsin | 2,567,583 | 476,870 | 18.6 | 64.7 |
| 42 | Illinois | 5,134,283 | 951,958 | 18.5 | 75.8 |
| 43 | New York | 7,867,612 | 1,380,935 | 17.6 | 59.9 |
| 44 | Utah | 1,208,124 | 207,497 | 17.2 | 78.5 |
| 45 | New Jersey | 3,565,008 | 576,558 | 16.2 | 75.1 |
| 46 | Alaska | 278,920 | 43,009 | 15.4 | 49.2 |
| 47 | Rhode Island | 450,467 | 62,165 | 13.8 | 53.6 |
| 48 | Maine | 620,759 | 83,008 | 13.4 | 9.5 |
| 49 | New Hampshire | 574,089 | 70,714 | 12.3 | 21.8 |
| 50 | Michigan | 4,150,990 | 503,119 | 12.1 | 75.4 |
| 51 | Vermont | 285,750 | 31,323 | 11.0 | 17.8 |
ACS 2025 1-year table B25040. Occupied housing units; the fuel used most for heating. Electricity includes heat pumps, electric furnaces and baseboard heat.
Source: [14] U.S. Census Bureau
The ACS does not ask whether the electric heat is a heat pump. EIA's Residential Energy Consumption Survey does: in 2020, 16.13 million homes (13.1%) used a central heat pump as main heating equipment and 1.06 million used a ductless mini-split (RECS HC6.7; HC6.8).
The South accounted for 12.52 million of those central heat pump homes, 77.6% of the US total, and 26.7% of all Southern homes. The share was 6.3% in the West, 4.0% in the Midwest and 3.6% in the Northeast.
Share of homes using a central heat pump as main heating equipment, by census region, percent
Source: ECW calculation from EIA Residential Energy Consumption Survey 2020, tables HC6.7 and HC6.8
| Census region | Homes (million) | Main heat: electricity (%) | Main heat: central heat pump (%) | Main heat: ductless mini-split (million homes) | Main heat: natural gas (%) |
|---|---|---|---|---|---|
| United States | 123.53 | 34.5 | 13.1 | 1.06 | 50.8 |
| Northeast | 21.92 | 18.2 | 3.6 | 0.25 | 55.8 |
| Midwest | 27.04 | 19.2 | 4.0 | Q (withheld) | 69.6 |
| South | 46.84 | 55.0 | 26.7 | 0.39 | 33.2 |
| West | 27.72 | 27.5 | 6.3 | 0.35 | 58.2 |
EIA RECS 2020 (final release March 2023). Q means EIA withheld the estimate for sampling reasons.
Source: [18][19] U.S. Energy Information Administration; U.S. Energy Information Administration
Are heat pumps worth it? Official sources say it depends on the fuel replaced and the climate
DOE and NREL describe large energy savings and bill savings for most, not all, households. The conditions matter more than the headline. This section reports what the agencies state; it is not advice for any home.
DOE says a properly installed air-source heat pump can deliver two to four times more heat energy than the electricity it uses, and that a 10.3 HSPF heat pump provides 10,300 Btu per kWh against about 3,400 Btu for an electric resistance element (DOE Energy Saver).
Where electricity is the only option, DOE says heat pumps easily cut electricity use by 50% compared with electric resistance heating, with exceptions in climates with very few heating days (DOE Energy Saver).
NREL simulated 550,000 representative households and found 62% to 95% would see lower energy bills with a heat pump, depending on its efficiency, and 82% to 97% with weatherization (NREL). For the 49 million homes heated by electricity, fuel oil or propane that already have air conditioning, 92% to 100% would save, with median savings of $300 to $650 a year.
NREL also notes that site energy savings are larger than bill savings because natural gas is cheaper than electricity per Btu in many areas, and that installation cost makes heat pumps financially feasible for a smaller share of households. Electricity prices by state are on average electric bill by state.
What rising heat pump sales mean for electrical contractors
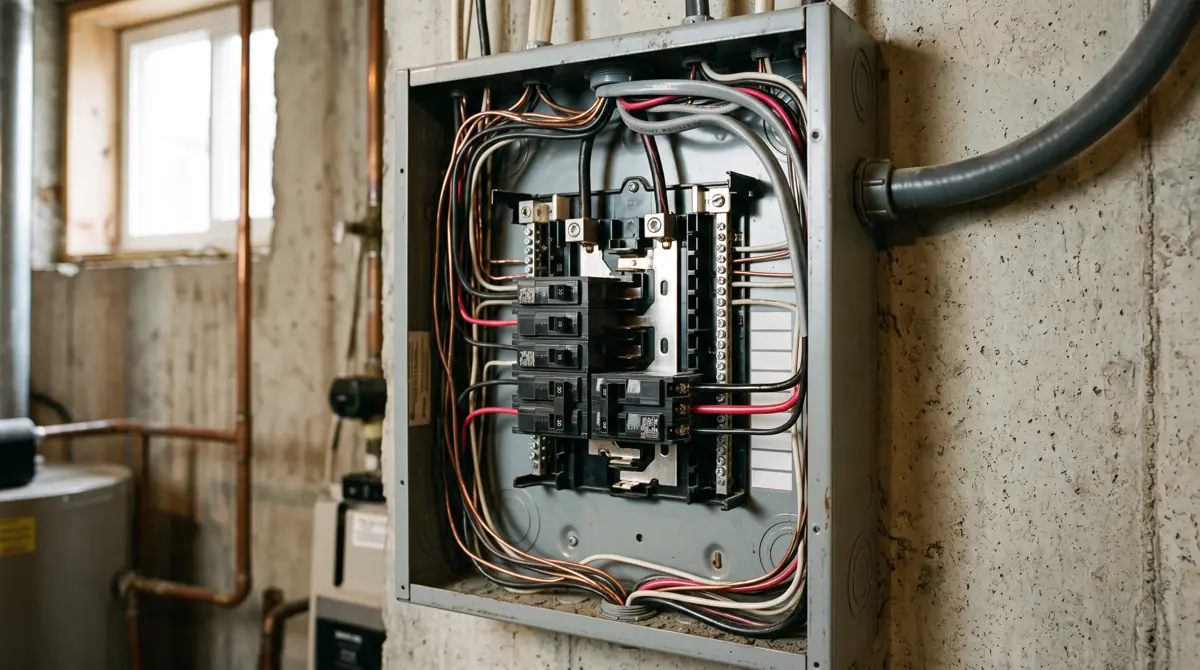
Every heat pump replacing a gas furnace adds an electric heating load, and many homes need a circuit, breaker space or a service check before installation. In 2020 fewer than one in five homes in the Northeast and Midwest heated with electricity, so most homes there that add a heat pump start from gas, oil or propane heat and add a new electric heating load.
New York's Clean Heat installer guide treats 100-amp service as the screening threshold for an air-source heat pump, says a heat pump can draw up to 60 amps at startup depending on size and style, and tells installers to run an NEC-aligned load calculation before work begins (NYSERDA Clean Heat Connect). It also says a licensed electrician should make the final assessment.
DOE's Energy Saver page lists improper wiring of electric resistance auxiliary heat strips among common heat pump installation problems and notes that energy codes require controls to stop unnecessary strip heat (DOE).
Panel and service upgrade prices are covered in electrical panel upgrade cost; low-voltage and controls work is covered in EV, solar and low-voltage. Wiring on any heat pump circuit should be done or checked by a licensed electrician.
The math behind the moves
Heat pump lead over gas furnaces, 2025
FormulaHP 2025 - gas furnaces 2025; HP / gas - 1
Inputs: fact rows for 2025 annual shipments (AHRI December 2025) (fact sheet rows)
Result: 397,170 units; 12.2%
Heat pumps kept the lead in a year when heat pump shipments fell and gas furnaces rose.
Limitations: Shipments, not installations; a home may use several heat pumps.
Heat pump share of heat pump plus gas furnace shipments by year
FormulaHP / (HP + gas furnaces) x 100
Inputs: annual fact rows 2010 to 2025 (fact sheet rows)
Result: 41.6% (2010) to 56.9% (2024) to 52.9% (2025)
The share crossed 50% in 2020 and peaked in 2024.
Limitations: Ratio of two AHRI categories; excludes boilers, oil furnaces and electric furnaces.
Latest 12 months
Formulasum of monthly shipments, September 2025 to August 2026
Inputs: monthly rows in table t2 (fact sheet rows)
Result: HP 3,801,992; gas 3,137,654; share 54.8%
Heat pumps led gas furnaces by 21.2% over the latest 12 months, wider than in calendar 2025.
Limitations: Late-2025 months not yet revised.
Change in the refrigerant transition year
Formula2025 / 2024 - 1
Inputs: annual fact rows 2024 and 2025 (fact sheet rows)
Result: HP -11.6%; gas 4.1%; AC -26.2%
Products that changed refrigerant (heat pumps, ACs) fell; gas furnaces, which did not, rose.
Limitations: Coincidence in time; pre-buying in 2024 inflated the base year.
First eight months after 25C ended
Formulasum Jan-Aug 2026 / sum Jan-Aug 2025 - 1
Inputs: monthly rows 2025-01 to 2026-08 (fact sheet rows)
Result: HP 5.7%; gas -5.0%
No sustained drop in heat pump shipments followed the end of the federal credit through August 2026.
Limitations: Compared with a weak 2025 base; eight months only.
Electricity share of home heating by state, 2025
FormulaB25040_004 / B25040_001
Inputs: ACS 2025 fact rows (fact sheet rows)
Result: US 41.8%; top Florida 89.4%; bottom Vermont 11.0%
Electric heat is concentrated in the Southeast.
Limitations: Survey estimate; does not identify heat pumps.
Central heat pump as main heat by census region, 2020
Formulaheat pump homes / all homes
Inputs: RECS 2020 fact rows (fact sheet rows)
Result: United States 13.1%; Northeast 3.6%; Midwest 4.0%; South 26.7%; West 6.3%
The South held 77.6% of central heat pump homes.
Limitations: 2020 data; mini-splits counted separately.
Numbers to watch
- US air-source heat pump shipments were 3,644,596 units in 2025, 397,170 more than gas warm air furnaces (3,247,426), per AHRI.[3]
- In the 12 months from September 2025 to August 2026, US heat pump shipments were 3,801,992 and gas furnace shipments 3,137,654, a ratio of 1.21 heat pumps per gas furnace.[2][3][7]
- Calendar 2020 was the first year in the AHRI series since 2010 in which US heat pump shipments (3,418,478) exceeded gas furnace shipments (3,351,176).[6]
- US heat pump shipments peaked at 4,334,479 units in 2022; the 2025 total was 15.9% below that record.[3][5]
- US heat pump shipments fell 11.6% from 2024 to 2025, while gas furnace shipments rose 4.1%, per AHRI.[3][4]
- US central air conditioner shipments fell 26.2% in 2025, from 5,559,766 to 4,104,933.[3][4]
- In 2023, the first year of DOE's SEER2 standards, US heat pump shipments fell 16.6% and gas furnace shipments fell 22.8%.[5][11]
- US heat pump shipments in January to August 2026 were 2,908,644, up 5.7% from 2,751,248 a year earlier; gas furnaces fell 5.0%.[2]
- Heat pumps were 47.0% of US heat pump plus central AC shipments in 2025, up from 33.8% in 2010.[3][1]
- Annual US heat pump shipments grew 108.5% from 2010 to 2025; gas furnace shipments grew 32.4%.[3][1]
- 41.8% of the 134,063,422 occupied US homes used electricity as their main heating fuel in 2025, and 46.9% used utility gas (ACS 1-year).[14]
- Electricity heated more homes than utility gas in 19 of 51 states (including DC) in 2025, and more than half of homes in 16.[14]
- The South held 77.6% of the 16.13 million US homes that used a central heat pump as main heating equipment in 2020 (EIA RECS).[19]
- NREL's simulation of 550,000 households found 62% to 95% of US households would see lower energy bills with an air-source heat pump, depending on efficiency.[22]
In short
- AHRI members shipped 3,644,596 air-source heat pumps and 3,247,426 gas warm air furnaces in the US in 2025, so heat pumps led by 397,170 units (12.2%).
- Heat pumps first outshipped gas furnaces in calendar 2020, lost the lead in 2021, and have led every year from 2022 to 2025.
- The heat pump share of heat pump plus gas furnace shipments rose from 41.6% in 2010 to a peak of 56.9% in 2024, then slipped to 52.9% in 2025.
- In 2025, the first year of EPA's 700 GWP refrigerant limit, heat pump shipments fell 11.6% and central AC shipments fell 26.2%, while gas furnaces rose 4.1%.
- In January to August 2026, the first eight months without the 25C credit, heat pumps rose 5.7% and gas furnaces fell 5.0% compared with the same months of 2025.
- Heat pumps outshipped central air conditioners for the first time in September 2025 (265,689 vs 263,291) and stayed ahead through January 2026.
- 41.8% of US occupied homes heated mainly with electricity in 2025, from 89.4% in Florida to 11.0% in Vermont (Census ACS).
- In EIA's 2020 survey, 26.7% of Southern homes used a central heat pump as main heat, against 3.6% in the Northeast.
What people search for
Are heat pumps outselling furnaces?
Yes, if furnaces means gas furnaces. AHRI counted 3,644,596 heat pumps and 3,247,426 gas furnaces shipped in the US in 2025, and 3,801,992 heat pumps vs 3,137,654 gas furnaces from September 2025 to August 2026.
How many heat pumps are sold each year?
AHRI members shipped 3,644,596 air-source heat pumps in the US in 2025, 4,122,004 in 2024 and a record 4,334,479 in 2022. Ground-source heat pumps are not in this count.
Are heat pumps worth it?
Official sources say it depends. NREL found 62% to 95% of US households would see lower energy bills, depending on heat pump efficiency, and DOE says heat pumps easily cut electricity use by 50% against electric resistance heat. Savings are smaller where gas is cheap, and installation cost is the main barrier.
Why are heat pump sales down?
Calendar 2025 heat pump shipments fell 11.6% as new equipment switched to A2L refrigerants under EPA's January 1, 2025 limit, after some distributors stocked older equipment in 2024. Sales are no longer falling: January to August 2026 shipments were 5.7% above the same months of 2025.
Common questions
When did heat pumps first outsell gas furnaces in the US?
On a calendar-year basis, in 2020: 3,418,478 heat pumps vs 3,351,176 gas furnaces, per AHRI. Gas furnaces led again in 2021, and heat pumps have led every year from 2022 to 2025.
What share of heating equipment sales are heat pumps?
Heat pumps were 52.9% of combined heat pump and gas furnace shipments in 2025 and 54.8% in the 12 months to August 2026 (AHRI). The ratio leaves out boilers, oil furnaces and electric furnaces.
Did heat pump sales drop after the tax credit ended?
January 2026 shipments were -16.5% below January 2025, but January to August 2026 shipments were 5.7% higher than a year earlier, per AHRI's August 2026 release. The 25C credit covered improvements made through December 31, 2025.
How did the 2025 refrigerant change affect heat pump sales?
US heat pump shipments fell from 4,122,004 in 2024 to 3,644,596 in 2025 (-11.6%) as EPA's 700 GWP limit took effect on January 1, 2025. Central AC shipments fell 26.2%.
What was the record year for heat pump shipments?
2022, with 4,334,479 air-source heat pumps shipped in the US, per AHRI's December 2023 release. 2025 was 15.9% below that level.
Do more heat pumps ship than central air conditioners?
In calendar 2025, no: 4,104,933 central ACs vs 3,644,596 heat pumps. But heat pumps outshipped ACs in each month from September 2025 to January 2026, starting with 265,689 vs 263,291 in September 2025.
Which states heat with electricity the most?
Florida (89.4%), South Carolina (69.6%) and Alabama (67.5%) had the highest share of homes heated mainly by electricity in 2025, per the ACS 1-year estimates. Vermont had the lowest at 11.0%.
How many US homes use a heat pump for heat?
EIA's 2020 RECS counted 16.13 million homes using a central heat pump and 1.06 million using a ductless mini-split as main heating equipment, out of 123.53 million homes.
Does a heat pump need a panel upgrade?
Not always. New York's Clean Heat installer guide uses 100-amp service as a screening threshold and says a heat pump can draw up to 60 amps at startup. A licensed electrician should run the load calculation; costs are on the panel upgrade cost page.
How often is this data updated?
AHRI aims to publish on the second Friday of each month, covering shipments two months earlier, so September 2026 data is due in November 2026. This page is rebuilt from each new AHRI release and from new Census and EIA survey years.
Get the data
Every table in this report is available as a CSV under CC BY 4.0. The fact sheet lists each value with its source URL and access date.
- derived_metrics.csv (CSV)
- fact_sheet.csv (CSV)
- US heat pump, gas furnace and central AC shipments by year, 2010 to 2025 (CSV)
- US monthly shipments: air-source heat pumps, gas furnaces and central AC (CSV)
- Monthly change from a year earlier, January 2025 to August 2026 (CSV)
- Share of homes heated mainly by electricity, all states and DC, 2025 (CSV)
- Main heating fuel and equipment by census region, 2020 (CSV)
- Latest 12 months vs prior 12 months (CSV)
- Policy dates and the shipment change that followed (CSV)
Cite this report
The figures to cite first
- US heat pump shipments totaled 3,801,992 units from September 2025 to August 2026, against 3,137,654 gas furnaces, according to AHRI data compiled by Electrical Contractors and Wiring.[2][3][7]
- Heat pumps were 54.8% of US heat pump plus gas furnace shipments in the 12 months to August 2026 (AHRI).[2][3][7]
- US heat pump shipments fell 11.6% in 2025 and rose 5.7% in January to August 2026 (AHRI).[2][3][4]
Quotable figures
- US heat pump shipments totaled 3,801,992 units from September 2025 to August 2026, against 3,137,654 gas furnaces, according to AHRI data compiled by Electrical Contractors and Wiring.[2][3][7]
- Air-source heat pumps outshipped gas furnaces in the US in 2025 by 397,170 units, 3,644,596 to 3,247,426 (AHRI).[3]
- US heat pump shipments fell 11.6% in 2025, the first year of EPA's refrigerant limit, while gas furnace shipments rose 4.1% (AHRI).[3][4][8]
- US heat pump shipments rose 5.7% in January to August 2026, the first months after the 25C tax credit ended, while gas furnaces fell 5.0% (AHRI).[2]
- In September 2025, US heat pump shipments (265,689) exceeded central air conditioner shipments (263,291) for the first time in the AHRI monthly series.[7]
- 41.8% of US occupied homes were heated mainly by electricity in 2025, from 89.4% in Florida to 11.0% in Vermont (Census ACS 2025 1-year).[14]
- In 2020, 26.7% of homes in the US South used a central heat pump as main heat, compared with 3.6% in the Northeast (EIA RECS 2020).[18][19]
Summary for editors
US heat pump shipments reached 3,801,992 units in the 12 months to August 2026, ahead of 3,137,654 gas furnaces, according to an analysis of AHRI monthly releases by Electrical Contractors and Wiring. Heat pumps first outshipped gas furnaces in 2020 and have led every year since 2022. The 2025 refrigerant transition coincided with an 11.6% drop in heat pump shipments to 3,644,596, while gas furnaces rose 4.1%. After the federal 25C credit ended on December 31, 2025, heat pump shipments fell 16.5% in January 2026 and then recovered, ending January to August 5.7% higher. In September 2025 heat pumps also outshipped central air conditioners for the first time. Census data show 41.8% of US homes heat mainly with electricity, led by Florida at 89.4%. The report includes the full monthly series as CSV under CC BY 4.0.
Headlines the data supports
- Heat pumps outsold gas furnaces by 21.2% over the past 12 months
- Heat pump shipments fell 11.6% in the refrigerant switch year, then recovered
- No 25C credit, no slump: heat pump shipments up through August 2026
- Heat pumps passed central air conditioners in September 2025
- Florida heats 89.4% of homes with electricity; Vermont 11.0%
Citation
Electrical Contractors and Wiring. (2026). Heat Pump Sales in the US: AHRI Shipments vs Gas Furnaces, 2010 to 2026. Retrieved from https://electricalcontractorsandwiring.com/data/heat-pump-sales/
Reuse
Data and tables are licensed CC BY 4.0. Attribution: “Source: Electrical Contractors and Wiring, Heat Pump Sales in the US: AHRI Shipments vs Gas Furnaces, 2010 to 2026” with a link to this page.
How we built this report
Shipments: ECW opened every AHRI monthly statistical release linked from AHRI's Monthly Shipments page (January 2010 to August 2026). Releases that downloaded directly were used as is; ahrinet.org returned a Cloudflare challenge for most PDF files, so those were taken from Internet Archive copies, and each fact sheet row links the exact file opened. Releases with neither a direct copy nor an archive copy were logged in excluded.md. The latest release used is August 2026, published October 9, 2026.
Annual totals are AHRI December year-to-date figures, which AHRI says equal the calendar year. For each year ECW used the prior-year column of the following December release where available, because it includes revisions; 2025 comes from AHRI's December 2025 Excel file. Monthly values follow the same rule (the following year's release of the same month first). Monthly values were cross-checked two ways: the 12 months of each year sum to the December total within 0.31%, and 327 of 331 month-versus-YTD-difference checks agree within 3% (the exceptions are 2011 releases whose printed year-to-date totals are internally inconsistent).
The monthly table covers all 200 months from January 2010 to August 2026. Releases that could not be opened are listed in excluded.md; every month they would have supplied is printed in another opened release (as the prior-year column), so no month is estimated.
Derived metrics (shares, year-over-year changes, 12-month sums) are computed in scripts/compute.py from the fact sheet and listed in derived_metrics.csv. The heat pump share is heat pumps divided by heat pumps plus gas warm air furnaces; it ignores boilers, oil furnaces and electric furnaces.
Housing data: Census ACS 1-year table B25040 (2025, released October 29, 2026; also 2024 and 2021) from the table-based summary file, and EIA RECS 2020 tables HC6.7 and HC6.8 (final release March 2023). RECS 2020 is the latest RECS; ACS estimates carry margins of error listed in the fact sheet.
Policy dates come from the Federal Register (DOE 82 FR 1786 and 82 FR 24211; EPA 88 FR 73098, 90 FR 47999 and 91 FR 31284) and the IRS. Shipment changes next to each date show what happened afterwards, not what the policy caused.
Operating cost statements come only from DOE Energy Saver pages (Internet Archive copies, because energy.gov returned errors to scripted requests) and the NREL news release on its 2024 Joule study. Vendor and marketplace savings claims were excluded. Search volumes were used only to choose question wording.
Conflicts: one trade publication described February 2026 heat pump growth as 16%; AHRI's February 2026 release prints +5.8%, which this report uses. Last updated 2026-11-05.
This report presents published data with its limitations. It is not legal, financial or investment advice.
Sources by tier
Tier 1: primary and official sources (16)
- [8] U.S. Environmental Protection Agency, Federal Register. Phasedown of Hydrofluorocarbons: Restrictions on the Use of Certain HFCs Under the AIM Act, final rule (88 FR 73098). Published October 24, 2023. Accessed 2026-11-03.
- [9] U.S. Environmental Protection Agency, Federal Register. Phasedown of HFCs: Reconsideration of Certain Regulatory Requirements Under the Technology Transitions Provisions, final rule (91 FR 31284). Published May 26, 2026; effective July 27, 2026. Accessed 2026-11-05.
- [10] U.S. Environmental Protection Agency, Federal Register. Phasedown of HFCs: Reconsideration of Technology Transitions requirements, proposed rule (90 FR 47999). Published October 3, 2025. Accessed 2026-11-05.
- [11] U.S. Department of Energy, Federal Register. Energy Conservation Standards for Residential Central Air Conditioners and Heat Pumps, direct final rule (82 FR 1786). Published January 6, 2017; compliance January 1, 2023. Accessed 2026-11-03.
- [12] U.S. Department of Energy, Federal Register. Energy Conservation Standards for Residential Central Air Conditioners and Heat Pumps, confirmation of effective date (82 FR 24211). Published May 26, 2017. Accessed 2026-11-05.
- [13] Internal Revenue Service. Energy Efficient Home Improvement Credit. Improvements made 2023 to 2025. Accessed 2026-11-05.
- [14] U.S. Census Bureau. American Community Survey 2025 1-year, B25040 House Heating Fuel (table-based summary file). 2025; released October 29, 2026. Accessed 2026-11-03.
- [15] U.S. Census Bureau. American Community Survey 2024 1-year, B25040 House Heating Fuel. 2024. Accessed 2026-11-05.
- [16] U.S. Census Bureau. American Community Survey 2021 1-year, B25040 House Heating Fuel. 2021. Accessed 2026-11-05.
- [17] U.S. Census Bureau. 2025 ACS 1-Year Estimates release notice. Released October 29, 2026. Accessed 2026-11-05.
- [18] U.S. Energy Information Administration. Residential Energy Consumption Survey 2020, Table HC6.7 Space heating in the Northeast and Midwest. 2020; final release March 2023. Accessed 2026-11-03.
- [19] U.S. Energy Information Administration. Residential Energy Consumption Survey 2020, Table HC6.8 Space heating in the South and West. 2020; final release March 2023. Accessed 2026-11-03.
- [20] U.S. Department of Energy. Air-Source Heat Pumps, Energy Saver (Internet Archive copy of June 20, 2026). Page as of June 2026. Accessed 2026-11-05.
- [21] U.S. Department of Energy. Electric Resistance Heating, Energy Saver (Internet Archive copy of May 5, 2026). Page as of May 2026. Accessed 2026-11-05.
- [22] National Renewable Energy Laboratory, via EurekAlert. Benefits of heat pumps detailed in new NREL report (news release on the Joule study by Wilson et al.). February 2024. Accessed 2026-11-05.
- [23] NYSERDA, NYS Clean Heat Connect. The Heat Pump Installer's Guide to Assessing Residential Electrical Service. Live page, checked 2026-11-05. Accessed 2026-11-05.
Tier 2: trade bodies, market research, company data (7)
- [1] Air-Conditioning, Heating, and Refrigeration Institute (AHRI). AHRI Monthly Shipments (index of monthly statistical releases, 2010 to 2026). Releases January 2010 to August 2026. Accessed 2026-11-03.
- [2] AHRI. AHRI Releases August 2026 U.S. Heating and Cooling Equipment Shipment Data (released October 9, 2026). August 2026 and Jan to Aug 2026. Accessed 2026-11-03.
- [3] AHRI. AHRI December 2025 public data, Excel (Internet Archive copy of July 17, 2026). December 2025 and calendar 2025. Accessed 2026-11-05.
- [4] AHRI. AHRI December 2024 Statistical Release (Internet Archive copy). Calendar 2024 and 2023. Accessed 2026-11-05.
- [5] AHRI. AHRI December 2023 Statistical Release (Internet Archive copy). Calendar 2023 and 2022. Accessed 2026-11-05.
- [6] AHRI. AHRI December 2021 Statistical Release. Calendar 2021 and 2020. Accessed 2026-11-03.
- [7] AHRI. AHRI September 2025 Statistical Release. September 2025. Accessed 2026-11-03.
Tier 3: journalism and expert commentary (1)
- [24] Canary Media. Heat pump sales dipped in 2025. They still beat gas furnaces.. 2025 annual data. Accessed 2026-11-05.