Lockout tagout statistics: OSHA citations, penalties and who gets cited, FY2015 to FY2026
- Data
- U.S. Department of Labor OSHA Violation and Inspection bulk files (data.dol.gov), filtered to 29 CFR 1910.147, 1910.303, 1910.305, 1910.333, 1926.405, 1926.416 and 1926.417
- Period
- Citations issued FY2015 to FY2026 (FY2026 preliminary); penalties for FY2025 citations
- Release used
- 2026-11-02
- Next release
- Daily refresh of the DOL bulk files; OSHA's final FY2026 Top 10 expected after year-end review
- Geography
- United States: federal OSHA and State Plans (29 CFR-numbered citations)
- Sources
- 36 (34 official)
Lockout tagout statistics from DOL enforcement records: federal OSHA and State Plans issued 4,748 lockout/tagout (1910.147) citations in fiscal 2025, carrying $20.8 million in current penalties (median $4,900 per penalized citation), plus 6,270 citations under six electrical standards. Manufacturers drew 68.8% of LOTO citations. The 120 deaths and 50,000 injuries figure is a projection from OSHA's 1989 rule.
Lockout tagout statistics: 4,748 LOTO citations in fiscal 2025
Lockout/tagout citations fell to a low of 3,015 in FY2021 and have climbed back toward FY2015 levels. Citations of the electrical standards fell by half over the same decade. State Plans now issue a growing share of LOTO citations.
Federal OSHA and State Plans issued 4,748 lockout/tagout citations under 29 CFR 1910.147 in FY2025 (October 1, 2024 to September 30, 2025), according to the DOL OSHA violation file dated 2026-11-02. Federal OSHA issued 2,535 and State Plans 2,213. The preliminary FY2026 count is 4,360.
Citation: One cited violation item. A single inspection can produce several items under the same standard. Citations are allegations until the employer accepts them, settles, or a final order is entered.
| Fiscal year (citation issued) | 1910.147 | 1910.333 | 1910.303 | 1910.305 | 1926.405 | 1926.416 | 1926.417 | Six electrical standards |
|---|---|---|---|---|---|---|---|---|
| FY2015 | 5,291 | 304 | 4,681 | 5,610 | 1,226 | 609 | 31 | 12,461 |
| FY2016 | 5,449 | 265 | 4,248 | 4,858 | 992 | 507 | 23 | 10,893 |
| FY2017 | 4,900 | 309 | 3,875 | 4,240 | 893 | 520 | 24 | 9,861 |
| FY2018 | 4,790 | 244 | 3,343 | 3,598 | 790 | 470 | 34 | 8,479 |
| FY2019 | 4,740 | 246 | 3,360 | 3,519 | 758 | 458 | 31 | 8,372 |
| FY2020 | 3,507 | 228 | 2,599 | 2,638 | 555 | 396 | 25 | 6,441 |
| FY2021 | 3,015 | 144 | 1,757 | 1,994 | 391 | 325 | 14 | 4,625 |
| FY2022 | 3,777 | 171 | 2,456 | 2,493 | 447 | 371 | 21 | 5,959 |
| FY2023 | 4,283 | 191 | 3,110 | 2,906 | 393 | 356 | 21 | 6,977 |
| FY2024 | 4,527 | 223 | 3,015 | 2,870 | 402 | 359 | 23 | 6,892 |
| FY2025 | 4,748 | 216 | 2,742 | 2,517 | 387 | 393 | 15 | 6,270 |
| FY2026 (preliminary) | 4,360 | 221 | 2,640 | 2,434 | 322 | 337 | 26 | 5,980 |
Counts are cited violation items, not inspections or employers, issued from Oct 1 to Sep 30. Deleted items and no-inspection records excluded. State Plans that cite their own rule numbers (California, Washington and most of Oregon and Michigan) are largely missing. FY2026 ended Sep 30, 2026 and is preliminary: contested and late items can still change. DOL bulk files dated 2026-11-02.
Source: [1][2] U.S. Department of Labor, OSHA, via DOL Open Data Portal; U.S. Department of Labor, OSHA, via DOL Open Data Portal
29 CFR 1910.147 citations issued, FY2015 to FY2026 (FY2026 preliminary)
Source: U.S. Department of Labor, OSHA violation and inspection bulk files (data.dol.gov, dated 2026-11-02); ECW analysis
Lockout/tagout counts in FY2025 were 10.3% below FY2015 (5,291). The six electrical standards fell further, by 49.7%, from 12,461 to 6,270 citations, driven by general industry wiring rules: 1910.305 fell from 5,610 to 2,517 citations and 1910.303 from 4,681 to 2,742.
Federal OSHA and State Plans combined, FY2015 to FY2026 (FY2026 preliminary)
Source: U.S. Department of Labor, OSHA violation and inspection bulk files (data.dol.gov, dated 2026-11-02); ECW analysis
Counting per inspection removes part of the swing in inspection volume. Federal OSHA issued 83.7 lockout/tagout citations per 1,000 federal inspections opened in FY2025 and 88.5 in FY2015. The FY2026 rate of 95.6 is inflated by the drop in federal inspections opened, from 30,275 in FY2025 to 21,671; the fiscal year included the October to November 2025 lapse in appropriations (91 FR 31358).
| Fiscal year | Federal citations | State Plan citations | State Plan share (%) | Federal inspections opened | Federal LOTO citations per 1,000 federal inspections | Federal inspections citing LOTO per 1,000 | OSHA published Top 10 rank | Computed federal rank (all standards) |
|---|---|---|---|---|---|---|---|---|
| FY2015 | 3,224 | 2,067 | 39.1 | 36,423 | 88.5 | 50.8 | 5 | 5 |
| FY2016 | 3,329 | 2,120 | 38.9 | 32,210 | 103.4 | 58.3 | not published | 5 |
| FY2017 | 3,008 | 1,892 | 38.6 | 32,611 | 92.2 | 52.7 | 5 | 5 |
| FY2018 | 2,819 | 1,971 | 41.1 | 32,257 | 87.4 | 49.1 | 5 | 5 |
| FY2019 | 2,871 | 1,869 | 39.4 | 33,597 | 85.5 | 48.8 | 4 | 4 |
| FY2020 | 2,031 | 1,476 | 42.1 | 21,860 | 92.9 | 54.1 | 6 | 6 |
| FY2021 | 1,590 | 1,425 | 47.3 | 24,421 | 65.1 | 36.2 | 7 | 7 |
| FY2022 | 2,076 | 1,701 | 45.0 | 31,827 | 65.2 | 36.5 | 6 | 6 |
| FY2023 | 2,473 | 1,810 | 42.3 | 34,223 | 72.3 | 39.4 | 6 | 7 |
| FY2024 | 2,591 | 1,936 | 42.8 | 34,626 | 74.8 | 40.5 | 5 | 5 |
| FY2025 | 2,535 | 2,213 | 46.6 | 30,275 | 83.7 | 46.9 | 4 | 4 |
| FY2026 (preliminary) | 2,071 | 2,289 | 52.5 | 21,671 | 95.6 | 50.7 | 3 | 3 |
Rates divide citations issued in a fiscal year by inspections opened in the same fiscal year (approximation: citations can follow the opening by up to six months). OSHA's published rank is read from its Top 10 page as saved by the Internet Archive; OSHA's archived pages show no FY2016 list. Computed rank orders all 29 CFR sections by federal citations issued in the year.
Source: [1][2][5][6][7][8][9][10][11][12][13][14][15] U.S. Department of Labor, OSHA, via DOL Open Data Portal; U.S. Department of Labor, OSHA, via DOL Open Data Portal; U.S. Department of Labor, Occupational Safety and Health Administration; U.S. Department of Labor, Occupational Safety and Health Administration; U.S. Department of Labor, Occupational Safety and Health Administration; U.S. Department of Labor, Occupational Safety and Health Administration; U.S. Department of Labor, Occupational Safety and Health Administration; U.S. Department of Labor, Occupational Safety and Health Administration; U.S. Department of Labor, Occupational Safety and Health Administration; U.S. Department of Labor, Occupational Safety and Health Administration; U.S. Department of Labor, Occupational Safety and Health Administration; U.S. Department of Labor, Occupational Safety and Health Administration; U.S. Department of Labor, Occupational Safety and Health Administration
Proposed lockout/tagout penalties fall by about a third before cases close
Penalties are proposed at citation and often reduced through informal settlement or contest. For FY2025 lockout/tagout citations the current total is 34.0% below the proposed total. Lockout/tagout items carry about 2.6 times the mean penalty of the electrical standards.
Penalties on FY2025 lockout/tagout citations totaled $31,507,200 as proposed and $20,807,979 as of the 2026-11-02 file, a 34.0% reduction. The median current penalty for items with a penalty above $0 was $4,900; the median proposed penalty was $7,093. 96.3% of FY2025 lockout/tagout items already carried a final order date.
| Standard | Citations | Initial penalty total | Current penalty total | Reduction initial to current (%) | Median current penalty (items above $0) | Mean current penalty per citation | Serious share (%) | Items contested | Federal mean current penalty per citation |
|---|---|---|---|---|---|---|---|---|---|
| 1910.147 | 4,748 | $31,507,200 | $20,807,979 | 34.0 | $4,900 | $4,382 | 75.9 | 627 | $6,132 |
| 1910.333 | 216 | $1,408,059 | $999,059 | 29.0 | $6,300 | $4,625 | 87.0 | 26 | $5,621 |
| 1910.303 | 2,742 | $6,707,653 | $4,441,192 | 33.8 | $2,800 | $1,620 | 57.4 | 225 | $2,744 |
| 1910.305 | 2,517 | $4,618,852 | $3,183,225 | 31.1 | $2,500 | $1,265 | 57.8 | 255 | $2,074 |
| 1926.405 | 387 | $486,049 | $378,514 | 22.1 | $1,702 | $978 | 50.1 | 29 | $1,858 |
| 1926.416 | 393 | $1,898,728 | $1,564,527 | 17.6 | $3,500 | $3,981 | 73.5 | 69 | $4,861 |
| 1926.417 | 15 | $104,171 | $69,431 | 33.3 | $5,959 | $4,629 | 73.3 | 3 | $5,637 |
| Six electrical standards | 6,270 | $15,223,512 | $10,635,947 | 30.1 | $2,800 | $1,696 | 59.2 | 607 |
Nominal dollars. Initial = penalty proposed at citation; current = amount after informal settlement, contest or amendment as of the 2026-11-02 file. Medians exclude $0 items because grouped items carry one penalty. Citations are allegations until a final order; 96.3% of FY2025 LOTO items had a final order date in the file. Federal OSHA and State Plans combined unless stated.
Source: [1][2] U.S. Department of Labor, OSHA, via DOL Open Data Portal; U.S. Department of Labor, OSHA, via DOL Open Data Portal
Items with a penalty above $0, federal OSHA and State Plans
Source: U.S. Department of Labor, OSHA violation bulk file (data.dol.gov, dated 2026-11-02); ECW analysis
The six electrical standards carried $10,635,947 in current penalties on 6,270 FY2025 citations, with a median of $2,800. Work-practice rules drew higher medians than wiring rules: $6,300 for 1910.333 and $3,500 for 1926.416, against $2,500 for 1910.305 and $1,702 for 1926.405.
Sum of 1910.147 penalties by fiscal year of citation, $ millions, FY2015 to FY2025
Source: U.S. Department of Labor, OSHA violation bulk file (data.dol.gov, dated 2026-11-02); ECW analysis
The ceiling for a serious or other-than-serious violation is $16,550 and for a willful or repeated violation $165,514, with a willful minimum of $11,823, for penalties proposed after January 15, 2025 (29 CFR 1903.15). DOL made no inflation adjustment for 2026 because the October 2025 CPI-U was not published (91 FR 31358). The serious maximum was $7,000 until the 2016 catch-up adjustment raised it to $12,471 (81 FR 43430), which helps explain why the mean current penalty per lockout/tagout citation rose 108.8% from FY2015 to FY2025, from $2,099 to $4,382.
FY2025 lockout/tagout citations included 153 repeat and 17 willful items; 75.9% were classified serious.
Manufacturers draw most LOTO citations; electrical contractors are cited under construction rules
The lockout/tagout standard covers general industry, so factories dominate its citations. Electrical contractors appear in the construction electrical rules, especially wiring methods (1926.405) and circuit lockout (1926.417).
Manufacturing (NAICS 31 to 33) received 14,007 of 20,350 lockout/tagout citations issued in FY2021 to FY2025, or 68.8%. Wholesale trade followed with 5.4% and administrative and waste services with 4.7%. The electrical standards are spread more widely: construction received 17.2% of them and public administration 8.8%.
| Sector (NAICS 2022) | NAICS | 1910.147 citations | Share of 1910.147 (%) | Six electrical standards citations | Share of electrical (%) |
|---|---|---|---|---|---|
| Manufacturing | 31-33 | 14,007 | 68.8 | 9,157 | 29.8 |
| Wholesale Trade | 42 | 1,099 | 5.4 | 1,331 | 4.3 |
| Administrative and Support and Waste Management and Remediation Services | 56 | 956 | 4.7 | 1,276 | 4.2 |
| Construction | 23 | 933 | 4.6 | 5,288 | 17.2 |
| Other Services (except Public Administration) | 81 | 606 | 3.0 | 1,392 | 4.5 |
| Utilities | 22 | 512 | 2.5 | 1,158 | 3.8 |
| Transportation and Warehousing | 48-49 | 447 | 2.2 | 1,531 | 5.0 |
| Retail Trade | 44-45 | 368 | 1.8 | 2,129 | 6.9 |
| Public Administration | 92 | 263 | 1.3 | 2,715 | 8.8 |
| Educational Services | 61 | 210 | 1.0 | 984 | 3.2 |
| All other sectors | 949 | 4.7 | 3,762 | 12.2 | |
| Total | 20,350 | 100.0 | 30,723 | 100.0 |
Five fiscal years pooled (citations issued Oct 1, 2020 to Sep 30, 2025), federal OSHA and State Plans. Sector is the establishment NAICS code recorded at inspection; sector titles from the Census Bureau 2022 NAICS file.
Source: [1][2][31] U.S. Department of Labor, OSHA, via DOL Open Data Portal; U.S. Department of Labor, OSHA, via DOL Open Data Portal; U.S. Census Bureau
Percent of 1910.147 citations, federal OSHA and State Plans
Source: U.S. Department of Labor, OSHA violation bulk file; Census Bureau 2022 NAICS; ECW analysis
Electrical contractors and other wiring installation contractors (NAICS 238210) received 26 lockout/tagout citations in five years, 0.13% of the total, because 1910.147 does not apply to construction work (29 CFR 1910.147). The same contractors received 304 citations under construction wiring rules (1926.405), 222 under construction work practices (1926.416) and 62 of the 94 citations under 1926.417, the construction rule for locking and tagging circuits, in 5,825 inspections.
| Standard | Title | 238210 citations FY2021 to FY2025 | 238210 citations FY2025 | All-industry citations FY2021 to FY2025 | 238210 share (%) |
|---|---|---|---|---|---|
| 1910.147 | Control of hazardous energy (lockout/tagout), general industry | 26 | 2 | 20,350 | 0.1 |
| 1910.333 | Electrical safety-related work practices, general industry | 76 | 16 | 945 | 8.0 |
| 1910.303 | Electrical, general requirements, general industry | 11 | 1 | 13,080 | 0.1 |
| 1910.305 | Electrical, wiring methods and equipment, general industry | 7 | 0 | 12,780 | 0.1 |
| 1926.405 | Electrical, wiring methods and equipment, construction | 304 | 67 | 2,020 | 15.0 |
| 1926.416 | Electrical safety-related work practices, construction | 222 | 44 | 1,804 | 12.3 |
| 1926.417 | Lockout and tagging of circuits, construction | 62 | 6 | 94 | 66.0 |
238210 = Electrical Contractors and Other Wiring Installation Contractors. Federal OSHA and State Plans. Inspections of 238210 establishments opened FY2021 to FY2025: 5,825.
Source: [1][2][31] U.S. Department of Labor, OSHA, via DOL Open Data Portal; U.S. Department of Labor, OSHA, via DOL Open Data Portal; U.S. Census Bureau
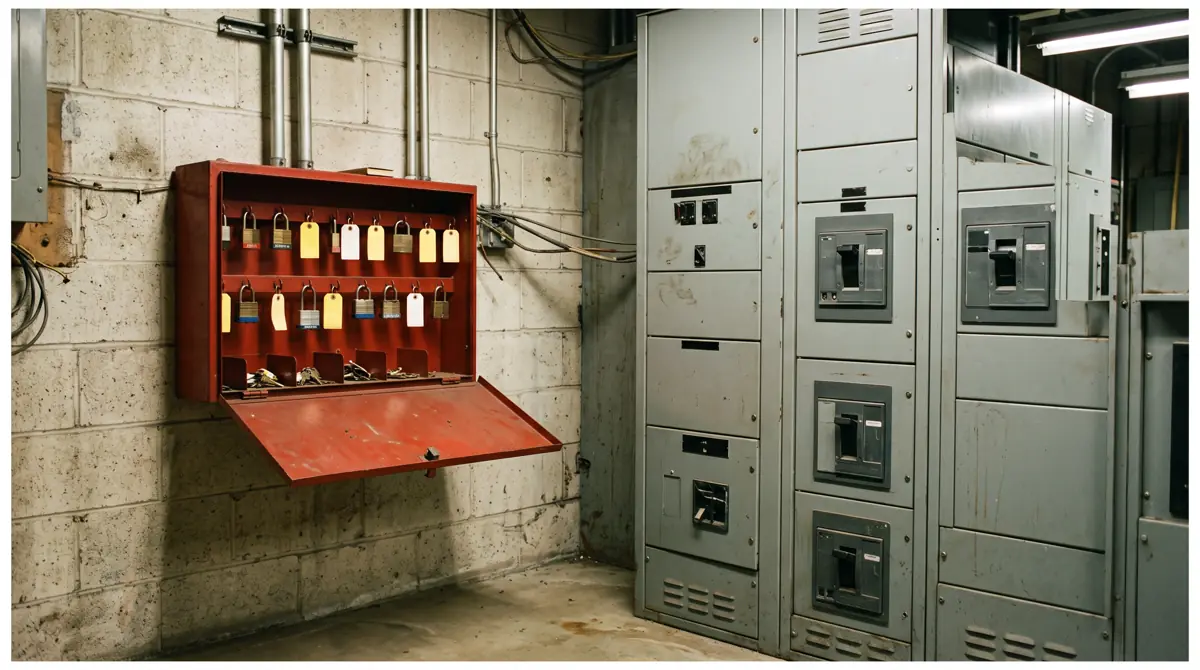
Most lockout/tagout citations concern paperwork and program elements rather than a single missed lock. Written energy control procedures, paragraph (c)(4)(i), drew 21.9% of citations in FY2021 to FY2025, training under (c)(7)(i) 18.1% and periodic inspections under (c)(6)(i) 14.9%. Together with the program requirement (c)(1), these four paragraphs account for 65.8%.
| Paragraph | What the paragraph requires (paraphrased) | Citations | Share of 1910.147 citations (%) |
|---|---|---|---|
| 1910.147(c)(4)(i) | Develop, document and use written energy control procedures | 4,463 | 21.9 |
| 1910.147(c)(7)(i) | Train employees in the purpose and function of the energy control program | 3,683 | 18.1 |
| 1910.147(c)(6)(i) | Inspect the energy control procedure periodically, at least annually | 3,027 | 14.9 |
| 1910.147(c)(1) | Establish an energy control program (procedures, training, inspections) | 2,224 | 10.9 |
| 1910.147(c)(4)(ii) | Procedures must spell out scope, purpose, authorization, rules and techniques for energy control | 1,670 | 8.2 |
| 1910.147(d) | Follow the application sequence for energy control (no subparagraph recorded) | 1,002 | 4.9 |
| 1910.147(c)(6)(ii) | Certify that periodic inspections were performed | 657 | 3.2 |
| 1910.147(c)(7)(iv) | Certify that employee training was completed and kept up to date | 482 | 2.4 |
Total 1910.147 citations in the period: 20,350. Paragraph read from the standard field of each violation. Requirement summaries are paraphrased from the eCFR text of 29 CFR 1910.147, not quoted.
Source: [1][24] U.S. Department of Labor, OSHA, via DOL Open Data Portal; Electronic Code of Federal Regulations (eCFR)
Tennessee issues the most electrical citations per inspection among comparable states
State totals follow inspection volume, so the rate per 1,000 inspections is the fairer comparison. Four State Plans cite their own rule numbers and cannot be compared on a 29 CFR basis.
Tennessee, a State Plan state, recorded 3,393 citations of the six electrical standards in FY2021 to FY2025, or 451.1 per 1,000 inspections, almost four times the 115.9 rate across the 46 states and DC that mostly cite 29 CFR numbers. Connecticut (317.8) and Hawaii (290.3) followed. Connecticut also had the highest lockout/tagout rate among the top 10 states, 165.2 per 1,000 inspections.
| Rank | State | Jurisdiction for private employers | Electrical citations | Electrical citations per 1,000 inspections | 1910.147 citations | 1910.147 citations per 1,000 inspections | Inspections opened | Share of all citations using 29 CFR numbers (%) |
|---|---|---|---|---|---|---|---|---|
| 1 | Tennessee | State Plan (private and public) | 3,393 | 451.1 | 768 | 102.1 | 7,521 | 89.4 |
| 2 | Virginia | State Plan (private and public) | 1,781 | 177.6 | 481 | 48.0 | 10,028 | 92.6 |
| 3 | Texas | Federal | 1,738 | 87.3 | 940 | 47.2 | 19,900 | 98.6 |
| 4 | New York | Federal (State Plan for public employers only) | 1,727 | 113.4 | 1,070 | 70.2 | 15,232 | 92.2 |
| 5 | Maryland | State Plan (private and public) | 1,581 | 249.9 | 572 | 90.4 | 6,326 | 93.7 |
| 6 | North Carolina | State Plan (private and public) | 1,399 | 144.6 | 979 | 101.2 | 9,672 | 98.2 |
| 7 | Connecticut | Federal (State Plan for public employers only) | 1,195 | 317.8 | 621 | 165.2 | 3,760 | 98.7 |
| 8 | Illinois | Federal (State Plan for public employers only) | 1,185 | 87.8 | 1,373 | 101.7 | 13,503 | 97.9 |
| 9 | Michigan | State Plan (private and public) | 1,148 | 63.3 | 1,881 | 103.8 | 18,128 | 36.0 |
| 10 | New Jersey | Federal (State Plan for public employers only) | 1,095 | 102.6 | 1,036 | 97.0 | 10,677 | 93.4 |
Citations issued FY2021 to FY2025; inspections opened in the same years (no-inspection records excluded). The last column shows how much of a state's enforcement (all citations on inspections opened since April 2013) is visible to a 29 CFR filter: California (3.7%) and Washington (2.1%) cite state rule numbers and cannot be ranked; Michigan (36.0%) and Oregon (45.8%) are only partly visible, so their counts are minimums. Jurisdiction from OSHA's State Plans page.
Source: [1][2][23] U.S. Department of Labor, OSHA, via DOL Open Data Portal; U.S. Department of Labor, OSHA, via DOL Open Data Portal; U.S. Department of Labor, Occupational Safety and Health Administration
Six electrical standards; states that mostly cite their own rule numbers are left blank
Source: U.S. Department of Labor, OSHA violation and inspection bulk files (data.dol.gov, dated 2026-11-02); ECW analysis
California and Washington cite their own state rule numbers: only 3.7% and 2.1% of their citations carry 29 CFR numbers, so their lockout and electrical citations do not appear in a federal-standard count. Michigan (36.0%) and Oregon (45.8%) are partly visible, so their counts are minimums. Jurisdiction follows OSHA's State Plans list: 22 plans cover private and public employers and 7 cover public employers only.
Lockout/tagout has appeared in every OSHA Top 10 published for FY2015 to FY2026
OSHA's annual Top 10 counts federal citations only. Lockout/tagout ranked between third and seventh in every published year; electrical standards dropped off the list after FY2017.
Lockout/tagout ranked fifth in OSHA's FY2015 list, fourth in FY2019 and FY2025, and third in the preliminary FY2026 list (OSHA Top 10). OSHA's archived pages show no FY2016 list; ranking all standards by federal citations in the DOL file puts lockout/tagout fifth that year. The computed rank matches OSHA's published rank in every year except FY2023, when 1910.147 and respiratory protection tied at 2,473 federal citations.
Electrical wiring methods (1910.305) ranked eighth and electrical general requirements (1910.303) tenth on OSHA's FY2015 list; 1910.305 last appeared, in tenth place, in FY2017. By federal citations, 1910.303 ranked 11th in each fiscal year from FY2022 to FY2026.
OSHA's published counts are preliminary snapshots. J. J. Keller reported 1,863 federal lockout/tagout citations for FY2026 through August 31, 2026; the full-year federal count in the November file is 2,071.
The 120 deaths and 50,000 injuries figure is a 1989 projection, not a count
This report found no federal dataset that counts deaths caused by lockout/tagout failures. The figure safety vendors repeat comes from OSHA's 1989 rulemaking estimate, restated in a 2002 fact sheet.
The September 1, 1989 final rule creating 1910.147 (54 FR 36644) estimated that the standard would prevent about 122 fatalities, 28,400 lost-workday injuries and 31,900 non-lost-workday injuries a year, based on 1984 accident levels. OSHA derived these by extrapolating national data: it judged 7.1% of general industry fatalities and 2% of nonfatal accidents to be lockout-related and assumed the rule would prevent 85% of them.
OSHA's 2002 lockout/tagout fact sheet rounded this to 120 fatalities and 50,000 injuries prevented each year (OSHA fact sheet, 2002). The rule's two injury estimates add to 60,300, 10,300 more than the fact sheet figure; the fact sheet gives no method. OSHA's current lockout/tagout overview page, read on 2026-11-03, does not repeat either figure (OSHA).
Later official evidence is narrower. OSHA's 2000 lookback review found the standard covered 3.3 million workers at 1 million facilities and cited union data showing 20% to 55% fewer fatalities from unexpected machine activation in auto and steel plants after 1989 (65 FR 38302). A study of OSHA accident summaries from 1984 to 1997 found lockout was not attempted in at least 58.8% of fatal lockout-related incidents in manufacturing (Bulzacchelli et al., 2008).
For current deaths and injuries from electricity at work, see this site's electrical injury statistics report, which uses the BLS fatality census and injury survey. No federal dataset reviewed for this report classifies deaths by whether a lockout procedure failed, so no official annual count of lockout/tagout deaths was found.
What OSHA enforcement records can and cannot show
Citation counts measure where inspectors went and what they found, not how often hazards occur.
- Counts depend on inspection volume and targeting, including emphasis programs and complaints; a falling count can reflect fewer inspections.
- Grouped violations carry one penalty, so many items show $0; medians exclude them.
- Recent penalties can still change through settlement or contest; FY2026 is preliminary.
- State Plans that cite their own rule numbers are undercounted, and State Plan inspections include public employers.
- Establishment NAICS codes are recorded by inspectors and can be missing or coarse.
- The DOL file names establishments, but this report aggregates and names no employer; a citation is an allegation until final.
This report is a statistical summary of public enforcement data, not legal or compliance advice. Electrical isolation and lockout work belongs with a licensed electrician; see the site's code and business sections and the electrical fire statistics report for related data.
The record in numbers
- Federal OSHA and State Plans issued 4,748 citations under the lockout/tagout standard (29 CFR 1910.147) in FY2025, in 2,628 inspections.[1]
- Lockout/tagout citations dropped to 3,015 in FY2021 and have risen in every year since, to 4,748 in FY2025.[1]
- State Plans issued 52.5% of lockout/tagout citations in preliminary FY2026 data (2,289 of 4,360), up from 39.1% in FY2015.[1]
- Federal OSHA issued 83.7 lockout/tagout citations per 1,000 federal inspections opened in FY2025, against 88.5 in FY2015.[1][2]
- Penalties on FY2025 lockout/tagout citations totaled $31.5 million as proposed and $20.8 million after settlement or contest, a 34.0% reduction.[1]
- The median current penalty for an FY2025 lockout/tagout item with a penalty was $4,900, which is 29.6% of the $16,550 serious-violation maximum.[1][21]
- The mean current penalty per lockout/tagout citation rose 108.8%, from $2,099 in FY2015 to $4,382 in FY2025 (nominal), after the 2016 catch-up raised the serious maximum from $7,000 to $12,471.[1][33]
- Six electrical standards drew 6,270 citations in FY2025 with $10.6 million in current penalties, down from 12,461 citations in FY2015.[1]
- Manufacturing (NAICS 31 to 33) received 14,007 of 20,350 lockout/tagout citations in FY2021 to FY2025, or 68.8%.[1][31]
- Electrical contractors (NAICS 238210) received 26 lockout/tagout citations in FY2021 to FY2025, 0.13% of the total, but 62 of the 94 citations under the construction circuit lockout rule 1926.417.[1]
- Four paragraphs of 1910.147 on written procedures, training, annual inspections and the program itself accounted for 65.8% of lockout/tagout citations in FY2021 to FY2025.[1][24]
- Tennessee recorded 451.1 electrical citations per 1,000 inspections in FY2021 to FY2025, against 115.9 across the states that mostly cite 29 CFR numbers.[1][2]
- Electrical general requirements (1910.303) ranked 11th among all standards by federal citations in each fiscal year from FY2022 to FY2026, one place outside OSHA's Top 10.[1]
- The 1989 lockout/tagout final rule projected 122 deaths, 28,400 lost-workday injuries and 31,900 minor injuries prevented per year, based on 1984 accident levels.[16]
Rates we calculated
Citations per fiscal year for each standard, FY2015 to FY2026
FormulaCount of non-deleted violation items by standard and fiscal year of issuance
Inputs: DOL violation and inspection files (fact rows 1 to 16; table t1) (fact sheet rows)
Result: 1910.147: 5,291 (FY2015) to 4,748 (FY2025), change -10.3%; six electrical standards: 12,461 to 6,270, change -49.7%
Lockout/tagout enforcement has recovered to near its FY2015 level, while electrical wiring citations have halved.
Limitations: Driven by inspection volume and targeting; State Plans with own numbering missing.
Total and median current penalty by standard, FY2025
FormulaSum and median (items above $0) of current_penalty; reduction = 1 - current / initial
Inputs: fact rows 18 to 22; table t3 (fact sheet rows)
Result: 1910.147: $20,807,979 current vs $31,507,200 initial (34.0% lower), median $4,900; six electrical standards $10,635,947, median $2,800
Lockout/tagout items carry 2.6 times the mean penalty of the electrical standards.
Limitations: Nominal dollars; open cases can change.
Share of 1910.147 citations by sector and the 238210 count
FormulaSector citations / all 1910.147 citations, FY2021 to FY2025 pooled
Inputs: table t4, t5; fact rows on manufacturing and NAICS 238210 (fact sheet rows)
Result: Manufacturing 68.8%; electrical contractors 26 citations (0.13%), but 588 under 1926.405, 1926.416 and 1926.417
Electrical contractors' hazardous-energy exposure is enforced through construction Subpart K, not 1910.147.
Limitations: NAICS as recorded at inspection.
Citations per 1,000 inspections
Formula1,000 x citations issued in a fiscal year / inspections opened in that fiscal year
Inputs: table t2; fact rows on inspections (fact sheet rows)
Result: Federal 1910.147: 88.5 (FY2015), 83.7 (FY2025), 95.6 (FY2026 preliminary); electrical contractors: 100.9 Subpart K citations per 1,000 238210 inspections (FY2021 to FY2025)
Per inspection, lockout/tagout enforcement intensity has been stable for a decade.
Limitations: Issuance year and opening year differ for some cases.
Top 10 states by electrical citations with State Plan flag
FormulaRank by citations of six electrical standards, FY2021 to FY2025; rate per 1,000 inspections
Inputs: table t6; chart c6 (fact sheet rows)
Result: Tennessee first by count (3,393) and rate (451.1 per 1,000); national comparable rate 115.9
State Plans and federal area offices cite electrical items at very different rates.
Limitations: California, Washington, Michigan and Oregon only partly visible.
1989 projection vs repeated figure
Formula28,400 + 31,900 = 60,300 injuries; 60,300 - 50,000
Inputs: fact rows on the 1989 rule and the 2002 fact sheet (fact sheet rows)
Result: 60,300 injuries and 122 deaths projected in 1989; the 50,000 figure is 10,300 lower
The commonly quoted figure is a rounded, partly unexplained restatement of a 1980s projection.
Limitations: Both are estimates, not counts.
What people search for
How many lockout tagout violations are there each year?
Federal OSHA and State Plans issued 4,748 lockout/tagout citations in FY2025 and a preliminary 4,360 in FY2026. Over FY2015 to FY2025 the yearly count ranged from 3,015 (FY2021) to 5,449 (FY2016), according to the DOL violation file.
What is the OSHA fine for lockout tagout?
The legal maximum is $16,550 per serious violation and $165,514 per willful or repeated violation (29 CFR 1903.15, unchanged for 2026). In practice, the median current penalty on FY2025 lockout/tagout items with a penalty was $4,900, and the mean per citation was $4,382.
How many deaths are caused by lockout tagout failures?
No official annual count was found. The often quoted 120 deaths figure is OSHA's 1989 projection of 122 deaths a year that the standard would prevent, based on 1984 accident levels. BLS data on deaths from electricity and machinery are covered in the electrical injury statistics report.
What are the most cited OSHA electrical standards?
In FY2025, 1910.303 (electrical general requirements) drew 2,742 citations and 1910.305 (wiring methods) 2,517, far ahead of construction wiring (1926.405, 387). By federal citations, 1910.303 ranked 11th among all standards in each year from FY2022 to FY2026.
In short
- Federal OSHA and State Plans issued 4,748 lockout/tagout citations in FY2025 (2,535 federal, 2,213 State Plan) and a preliminary 4,360 in FY2026.
- Lockout/tagout citations in FY2025 were 10.3% below FY2015 (5,291), while citations of six electrical standards fell 49.7%, from 12,461 to 6,270.
- Penalties on FY2025 lockout/tagout citations fell from $31.5 million proposed to $20.8 million current, a 34.0% reduction; the median current penalty was $4,900.
- Manufacturing accounted for 68.8% of lockout/tagout citations in FY2021 to FY2025; electrical contractors (NAICS 238210) received 26 of 20,350.
- Electrical contractors are cited under construction rules instead: 588 citations under 1926.405, 1926.416 and 1926.417 in FY2021 to FY2025.
- Lockout/tagout ranked third on OSHA's preliminary FY2026 Top 10 and has appeared in every published list from FY2015 to FY2026.
- The widely repeated 120 deaths and 50,000 injuries estimate traces to the 1989 final rule, which projected 122 deaths and 60,300 injuries prevented per year at 1984 accident levels.
Common questions
Is lockout/tagout in OSHA's top 10 most cited standards?
Yes. 1910.147 ranked third on OSHA's preliminary FY2026 list (Oct 1, 2025 to Aug 31, 2026) and fourth in FY2025, and it appears in every published list from FY2015 to FY2026.
How many lockout/tagout citations did federal OSHA issue in FY2025?
Federal OSHA issued 2,535 citations under 1910.147 in FY2025, and State Plans issued 2,213, for 4,748 in total.
Which part of the lockout/tagout standard is cited most?
Paragraph 1910.147(c)(4)(i), which requires written energy control procedures, drew 4,463 citations in FY2021 to FY2025, 21.9% of all lockout/tagout citations.
How much do OSHA lockout/tagout penalties get reduced?
For FY2025 citations, current penalties of $20.8 million were 34.0% below the $31.5 million proposed, reflecting settlements, contests and amendments recorded by 2026-11-02.
Do electrical contractors get cited for lockout/tagout?
Rarely under 1910.147: 26 citations in FY2021 to FY2025. Electrical contractors are cited under construction rules, including 62 citations under 1926.417 for locking and tagging circuits.
What does 1926.417 cover?
29 CFR 1926.417 sets lockout and tagging requirements for circuits in construction work. It drew 94 citations in FY2021 to FY2025, 62 of them at electrical contractors.
Which industries get the most lockout/tagout citations?
Manufacturing received 68.8% of 1910.147 citations in FY2021 to FY2025 (14,007 of 20,350), followed by wholesale trade at 5.4%.
Which states issue the most electrical citations?
Tennessee issued 3,393 citations of six electrical standards in FY2021 to FY2025, or 451.1 per 1,000 inspections, the highest count and rate among states that use 29 CFR numbers.
Where does the 50,000 injuries figure come from?
It appears in OSHA's 2002 lockout/tagout fact sheet. The 1989 final rule itself projected 28,400 lost-workday and 31,900 minor injuries prevented a year, 60,300 in total.
Why do California and Washington show so few lockout/tagout citations?
Both State Plans cite their own rule numbers; only 3.7% (California) and 2.1% (Washington) of their citations carry 29 CFR numbers, so a federal-standard count misses them.
Get the data
Every table in this report is available as a CSV under CC BY 4.0. The fact sheet lists each value with its source URL and access date.
- derived_metrics.csv (CSV)
- fact_sheet.csv (CSV)
- OSHA citations by standard and fiscal year, FY2015 to FY2026 (federal OSHA and State Plans) (CSV)
- Lockout/tagout (1910.147) citations: federal OSHA vs State Plans, rates and Top 10 rank, FY2015 to FY2026 (CSV)
- Penalties by standard, citations issued in FY2025: initial vs current (CSV)
- Who gets cited: lockout/tagout and electrical citations by industry sector, FY2021 to FY2025 (CSV)
- Electrical contractors (NAICS 238210): citations under the seven standards, FY2021 to FY2025 (CSV)
- Top 10 states by citations of the six electrical standards, FY2021 to FY2025 (CSV)
- Most cited paragraphs of the lockout/tagout standard, FY2021 to FY2025 (CSV)
Cite this report
The figures to cite first
- US lockout/tagout citations (29 CFR 1910.147): 4,748 in fiscal 2025, 2,535 federal and 2,213 State Plan, per DOL enforcement records.[1]
- Fiscal 2025 lockout/tagout penalties: $20.8 million current, median $4,900 per item with a penalty, per DOL enforcement records.[1]
- The 120 deaths and 50,000 injuries lockout/tagout estimate derives from OSHA's 1989 rulemaking projection of 122 deaths a year, not from a count of deaths (54 FR 36644).[16][18]
Quotable figures
- Federal OSHA and State Plans issued 4,748 lockout/tagout citations under 29 CFR 1910.147 in fiscal 2025, according to Department of Labor enforcement records.[1]
- Current penalties on fiscal 2025 lockout/tagout citations totaled $20.8 million, 34.0% below the $31.5 million OSHA and State Plans first proposed (DOL enforcement data).[1]
- The median current penalty on a fiscal 2025 lockout/tagout item with a penalty was $4,900, against a $16,550 serious-violation maximum (DOL data; 29 CFR 1903.15).[1][21]
- Manufacturers received 68.8% of US lockout/tagout citations in fiscal 2021 to 2025 (DOL enforcement data).[1]
- US citations of six OSHA electrical standards fell 49.7%, from 12,461 in fiscal 2015 to 6,270 in fiscal 2025 (DOL enforcement data).[1]
- OSHA's 1989 lockout/tagout rule projected 122 deaths and 60,300 injuries prevented per year at 1984 accident levels; the 120 and 50,000 figures are a later restatement (54 FR 36644; OSHA fact sheet 2002).[16][18]
Summary for editors
Federal OSHA and State Plans issued 4,748 citations under the lockout/tagout standard (29 CFR 1910.147) in fiscal 2025, according to an Electrical Contractors and Wiring Data Desk analysis of Department of Labor enforcement records dated 2026-11-02. Penalties on those citations totaled $31.5 million as proposed and $20.8 million after settlements and contests, a 34.0% reduction, with a median of $4,900 per item. Manufacturing received 68.8% of lockout/tagout citations in fiscal 2021 to 2025. Electrical contractors received only 26, because they are cited under construction rules instead, including 62 of 94 citations under the circuit lockout rule 1926.417. Citations of six electrical standards fell 49.7% in a decade, to 6,270 in fiscal 2025. Tennessee had the highest electrical citation rate, 451.1 per 1,000 inspections. The widely quoted 120 deaths and 50,000 injuries figure traces to OSHA's 1989 projection of 122 deaths prevented per year. Data are free to reuse under CC BY 4.0.
Headlines the data supports
- OSHA and states issued 4,748 lockout/tagout citations in fiscal 2025
- Lockout/tagout fines shrink by a third between proposal and settlement
- Manufacturers get 68.8% of lockout/tagout citations; electricians are cited under construction rules
- OSHA electrical citations fell by half in a decade, enforcement data show
- The 120 lockout/tagout deaths figure is a 1989 projection, not a count
Citation
Electrical Contractors and Wiring. (2026). Lockout tagout statistics: OSHA citations, penalties and who gets cited, FY2015 to FY2026. Retrieved from https://electricalcontractorsandwiring.com/data/lockout-tagout-statistics/
Reuse
Data and tables are licensed CC BY 4.0. Attribution: “Source: Electrical Contractors and Wiring, Lockout tagout statistics: OSHA citations, penalties and who gets cited, FY2015 to FY2026” with a link to this page.
How we built this report
Data: the U.S. Department of Labor OSHA Violation and Inspection bulk files from the DOL Open Data Portal (data.dol.gov), both dated 2026-11-02 and downloaded on 2026-11-03 without an API key. The full files (2.3 GB and 1.5 GB) were streamed and filtered; only the filtered violation extract, aggregate inspection counts and checksums of the deleted originals are kept in raw/extracts. Field meanings follow the DOL data dictionaries for datasets 10338 and 10334.
Selection: non-deleted violation items whose standard field begins with 1910.147, any 1910 Subpart S section (1910.301 to 1910.399) or any 1926 Subpart K section (1926.400 to 1926.449), on inspections with a scope other than D (no inspection). The report tables cover 1910.147 and six named electrical standards. Fiscal year follows the citation issuance date (October 1 to September 30), the convention OSHA's frequently cited standards pages use. Federal vs State Plan follows the third digit of the reporting office code (5 = State Plan), which matched OSHA's State Plans list in every state checked.
Validation: ranking every 29 CFR section by federal citations reproduces OSHA's published Top 10 rank for 1910.147 in each published year from FY2015 to FY2026 except FY2023 (a tie), and the FY2015 and FY2025 top 10 lists in full. The computed FY2026 federal mean penalty per lockout/tagout citation ($6,903) is within 1% of J. J. Keller's report of OSHA's preliminary figure ($6,836).
Penalties: initial_penalty is the amount proposed at citation; current_penalty is the amount on file after informal settlement, contest or amendment. Totals use current values; medians exclude $0 items because grouped items carry one penalty. Dollars are nominal. Citations are allegations until final; 96.3% of FY2025 lockout/tagout items had a final order date in the file.
Rates: citations issued in a fiscal year divided by inspections opened in the same fiscal year, times 1,000. Sector uses the first two digits of the establishment NAICS code with Census Bureau 2022 NAICS titles. State uses the site state. Requirement summaries for paragraphs are paraphrased from eCFR text.
Conflicts: OSHA's Top 10 counts are preliminary snapshots (federal only, partial year for FY2026) and differ from full-year counts in the November file; both are shown with their scope. Vendor pages repeating the 120 and 50,000 figure were not used as sources; the figure is traced to the 1989 Federal Register and OSHA's 2002 fact sheet.
Limitations: enforcement counts measure inspection activity, not hazard prevalence. State Plans that cite their own rule numbers (California, Washington, most of Oregon and Michigan) are undercounted. No employer is named. Not legal advice. Last updated 2026-11-05; scripts in scripts/ rebuild every table from the extracts.
This report presents published data with its limitations. It is not legal, financial or investment advice.
Sources by tier
Tier 1: primary and official sources (34)
- [1] U.S. Department of Labor, OSHA, via DOL Open Data Portal. OSHA Violation bulk file (OSHA_violation.zip, 14 CSV chunks dated 2026-11-02). Citations issued FY2015 to FY2026. Accessed 2026-11-03.
- [2] U.S. Department of Labor, OSHA, via DOL Open Data Portal. OSHA Inspection bulk file (OSHA_inspection.zip, 6 CSV chunks dated 2026-11-02). Inspections opened April 2013 to November 2026. Accessed 2026-11-03.
- [3] U.S. Department of Labor, Open Data Portal. Violation dataset (id 10338): description and data dictionary. Dataset metadata, published 2026-06-03. Accessed 2026-11-03.
- [4] U.S. Department of Labor, Open Data Portal. Inspection dataset (id 10334): description and data dictionary. Dataset metadata, published 2026-06-03. Accessed 2026-11-03.
- [5] U.S. Department of Labor, Occupational Safety and Health Administration. Top 10 Most Frequently Cited Standards, fiscal year 2026 (preliminary, updated 10/5/26). FY2026 (Oct 1, 2025 to Aug 31, 2026). Accessed 2026-11-03.
- [6] U.S. Department of Labor, Occupational Safety and Health Administration. Top 10 Most Frequently Cited Standards, fiscal year 2025 (Internet Archive copy, 2026-09-12). FY2025. Accessed 2026-11-05.
- [7] U.S. Department of Labor, Occupational Safety and Health Administration. Top 10 Most Frequently Cited Standards, fiscal year 2024 (Internet Archive copy, 2026-01-12). FY2024. Accessed 2026-11-03.
- [8] U.S. Department of Labor, Occupational Safety and Health Administration. Top 10 Most Frequently Cited Standards, fiscal year 2023 (Internet Archive copy, 2025-01-10). FY2023. Accessed 2026-11-03.
- [9] U.S. Department of Labor, Occupational Safety and Health Administration. Top 10 Most Frequently Cited Standards, fiscal year 2022 (Internet Archive copy, 2024-01-01). FY2022. Accessed 2026-11-03.
- [10] U.S. Department of Labor, Occupational Safety and Health Administration. Top 10 Most Frequently Cited Standards, fiscal year 2021 (Internet Archive copy, 2023-01-03). FY2021. Accessed 2026-11-03.
- [11] U.S. Department of Labor, Occupational Safety and Health Administration. Top 10 Most Frequently Cited Standards, fiscal year 2020 (Internet Archive copy, 2022-01-10). FY2020. Accessed 2026-11-03.
- [12] U.S. Department of Labor, Occupational Safety and Health Administration. Top 10 Most Frequently Cited Standards, fiscal year 2019 (Internet Archive copy, 2020-12-18). FY2019. Accessed 2026-11-03.
- [13] U.S. Department of Labor, Occupational Safety and Health Administration. Top 10 Most Frequently Cited Standards, fiscal year 2018 (Internet Archive copy, 2020-04-12). FY2018. Accessed 2026-11-03.
- [14] U.S. Department of Labor, Occupational Safety and Health Administration. Top Ten Standards, fiscal year 2017 (Internet Archive copy, 2019-01-01). FY2017. Accessed 2026-11-03.
- [15] U.S. Department of Labor, Occupational Safety and Health Administration. OSHA's 2015 Top Ten most frequently cited violations (Internet Archive copy, 2017-01-16). FY2015. Accessed 2026-11-03.
- [16] Office of the Federal Register (National Archives) via GovInfo. Control of Hazardous Energy (Lockout/Tagout); Final Rule, 54 FR 36644 to 36690 (Sept. 1, 1989), Federal Register issue scan. 1989 (estimates based on 1984 accident levels). Accessed 2026-11-03.
- [17] U.S. Department of Labor, Occupational Safety and Health Administration. Control of Hazardous Energy (Lockout/Tagout); Machinery, Equipment Maintenance; Final Rule (record page, 54:36644-36690). 1989. Accessed 2026-11-03.
- [18] U.S. Department of Labor, Occupational Safety and Health Administration. Lockout/Tagout fact sheet (2002), Internet Archive copy of 2021-01-26. 2002. Accessed 2026-11-05.
- [19] U.S. Department of Labor, Occupational Safety and Health Administration. Control of Hazardous Energy (Lockout/Tagout): Overview. Current page. Accessed 2026-11-03.
- [20] Office of the Federal Register (National Archives) via GovInfo. The Control of Hazardous Energy (Lockout/Tagout): Notice of the Availability of a Lookback Review, 65 FR 38302 (June 20, 2000). 1989 to 2000. Accessed 2026-11-05.
- [21] Electronic Code of Federal Regulations (eCFR). 29 CFR 1903.15, Proposed penalties. Penalties proposed after Jan 15, 2025. Accessed 2026-11-03.
- [22] Office of the Federal Register (National Archives) via GovInfo. Department of Labor Federal Civil Penalties Inflation Adjustment Act Annual Adjustments for 2026, 91 FR 31358 (May 27, 2026). 2026. Accessed 2026-11-03.
- [23] U.S. Department of Labor, Occupational Safety and Health Administration. State Plans. Current page. Accessed 2026-11-03.
- [24] Electronic Code of Federal Regulations (eCFR). 29 CFR 1910.147, The control of hazardous energy (lockout/tagout). Current text. Accessed 2026-11-03.
- [25] Electronic Code of Federal Regulations (eCFR). 29 CFR 1910.333, Selection and use of work practices. Current text. Accessed 2026-11-03.
- [26] Electronic Code of Federal Regulations (eCFR). 29 CFR 1910.303, General requirements (electrical). Current text. Accessed 2026-11-03.
- [27] Electronic Code of Federal Regulations (eCFR). 29 CFR 1910.305, Wiring methods, components, and equipment for general use. Current text. Accessed 2026-11-03.
- [28] Electronic Code of Federal Regulations (eCFR). 29 CFR 1926.405, Wiring methods, components, and equipment for general use (construction). Current text. Accessed 2026-11-03.
- [29] Electronic Code of Federal Regulations (eCFR). 29 CFR 1926.416, General requirements (safety-related work practices, construction). Current text. Accessed 2026-11-03.
- [30] Electronic Code of Federal Regulations (eCFR). 29 CFR 1926.417, Lockout and tagging of circuits. Current text. Accessed 2026-11-03.
- [31] U.S. Census Bureau. 2022 NAICS 2 to 6 digit codes. NAICS 2022. Accessed 2026-11-05.
- [32] U.S. National Library of Medicine, PubMed (abstract). Bulzacchelli MT, Vernick JS, Sorock GS, Webster DW, Lees PS. Circumstances of fatal lockout/tagout-related injuries in manufacturing. American Journal of Industrial Medicine, 2008. 1984 to 1997. Accessed 2026-11-05.
- [33] Office of the Federal Register (National Archives) via GovInfo. Department of Labor Federal Civil Penalties Inflation Adjustment Act Catch-Up Adjustments, 81 FR 43430 (July 1, 2016). 2016. Accessed 2026-11-05.
- [36] U.S. Department of Labor, Occupational Safety and Health Administration. OSHA Penalties (updated Jul. 2, 2025). 2025 amounts. Accessed 2026-11-03.
Tier 3: journalism and expert commentary (2)
- [34] J. J. Keller and Associates (Compliance Network). Fall protection for construction continues to lead OSHA's top 10 list. FY2026 preliminary. Accessed 2026-11-05.
- [35] J. J. Keller and Associates (Compliance Network). Expert Insights: New data reveals top 20 OSHA 1910 violations for FY 2026 (2026-10-02). FY2026 preliminary. Accessed 2026-11-05.