Electric car fires: official rates per vehicle, fire recalls and the lithium-ion battery problem
- Data
- Beredskabsstyrelsen Faktaark 2026 (Denmark, with Swedish and Norwegian rates); NHTSA recalls flat file
- Period
- 2018 to 2025 (fire rates); January 2021 to October 2026 (recalls); 2017 to 2025 (lithium-ion battery fires)
- Release used
- 2026-11-03
- Next release
- NHTSA recall file: daily; BRS fact sheet: annual (2027 edition for 2026 data)
- Geography
- Denmark, Sweden, Norway, United States, New York City
- Sources
- 29 (18 official)
Official counts of electric car fires per vehicle come from the Nordics, not the US. Denmark recorded 1.0 fire per 10,000 electric and hybrid cars in 2025 against 4.0 per 10,000 other cars; Sweden (2024) and Norway (2025) also show lower EV rates. No US agency publishes a fire rate by powertrain.
Electric car fires per vehicle: official Nordic rates are lower for EVs and hybrids than for other cars
Only a few agencies publish both the number of electric car fires and the fleet they come from. In Denmark, Sweden and Norway, the latest rates for electric and hybrid cars are 4.0 to 16.7 times lower than for other cars, but the counting rules differ by country.
Denmark's emergency management agency, Beredskabsstyrelsen (BRS), counts every fire service response to a fire involving at least one electric or hybrid car and divides by the registered fleet. In 2025 it recorded 62 such fires, or 1.0 per 10,000 electric and hybrid cars, against 4.0 fires per 10,000 other cars (Beredskabsstyrelsen Faktaark 2026).
BRS also republishes rates from its neighbours. Sweden recorded 0.45 fires per 10,000 electric and hybrid cars in 2024 against 7.50 for other cars; Norway recorded 0.55 against 3.90 in 2025. Swedish 2025 data were not yet available when BRS published.
| Country | Year | Fires in EV and hybrid cars | EV and hybrid fires per 100,000 | Other car fires per 100,000 | Ratio (other / EV and hybrid) | Counting rule |
|---|---|---|---|---|---|---|
| Denmark | 2025 | 62 | 10.0 | 40.0 | 4.0 | Includes EV fires that spread to buildings |
| Sweden | 2024 | 40 | 4.5 | 75.0 | 16.7 | Excludes EV fires recorded as building fires; other cars include arson |
| Norway | 2025 | 75 | 5.5 | 39.0 | 7.1 | Excludes EV fires recorded as building fires |
| Netherlands | 2025 | 246 | not published | not published | not available | No fleet or other-car data in the BRS comparison |
Rates per 10,000 published by Beredskabsstyrelsen (BRS) multiplied by 10. Each country counts differently; compare within a country, not across.
Source: [1] Beredskabsstyrelsen (Danish Emergency Management Agency, BRS)
Fires per 100,000 vehicles
Source: Beredskabsstyrelsen, Faktaark 2026, using BRS, MCF (Sweden) and DSB (Norway) data
Fires per 100,000 vehicles: Fires in one year divided by the number of registered vehicles of that type, times 100,000. It is the only denominator that measures how often a car on the road burns.
Sweden's own figures agree with the BRS rates. The Swedish Civil Contingencies Agency counted 40 electric or electric/hybrid cars in fires in 2024 (38 in 2023), against a fleet of just under 900,000, and just over 3,100 car fires of all fuels against nearly 4,100,000 other cars (MSB, 19 May 2025). That works out to about 4.4 fires per 100,000 electric and hybrid cars and 74.6 per 100,000 other cars.
Denmark is the only country with a published series. Its electric and hybrid rate peaked at 4.8 per 10,000 in 2019, when the count was 10 fires, and has stayed between 1.0 and 1.7 since 2021. The other-car rate held between 3.6 and 5.2 per 10,000 throughout.
| Year | Fires in EV and hybrid cars | EV and hybrid fires per 10,000 | Other car fires per 10,000 | EV and hybrid per 100,000 | Other cars per 100,000 | Ratio (other / EV and hybrid) |
|---|---|---|---|---|---|---|
| 2018 | 3 | 2.2 | 4.7 | 22 | 47 | 2.1 |
| 2019 | 10 | 4.8 | 5.2 | 48 | 52 | 1.1 |
| 2020 | 15 | 3.8 | 4.3 | 38 | 43 | 1.1 |
| 2021 | 16 | 1.7 | 3.6 | 17 | 36 | 2.1 |
| 2022 | 20 | 1.1 | 3.6 | 11 | 36 | 3.3 |
| 2023 | 46 | 1.7 | 3.6 | 17 | 36 | 2.1 |
| 2024 | 50 | 1.2 | 3.8 | 12 | 38 | 3.2 |
| 2025 | 62 | 1.0 | 4.0 | 10 | 40 | 4.0 |
Values read from the labelled points of Figure 1 in the BRS 2026 fact sheet. Ratio computed by the Data Desk from the rounded rates.
Source: [1] Beredskabsstyrelsen (Danish Emergency Management Agency, BRS)
Electric and hybrid cars vs all other cars
Source: Beredskabsstyrelsen, Faktaark 2026 (ODIN and Danmarks Statistik BIL54); per 100,000 = published rate per 10,000 x 10
Charging is a minority of the circumstances recorded. In Denmark, 4 of 76 fires involving electric and hybrid cars from January 2018 to June 2023 (5.3%) happened while the car was charging, while 18 (23.7%) were arson. In the Swedish 2018 to 2022 compilation, 18 of 81 cars (22.2%) were charging (BRS Faktaark 2023).
The US counts 178,500 highway vehicle fires a year but publishes no split by powertrain
US fire statistics are large and detailed but do not record whether a burned car was electric. The only federal estimate of EV fires is a 2026 NIST model, and its uncertainty band is wide.
NFPA estimates 178,500 highway vehicle fires in 2024, which caused 450 civilian deaths, 850 injuries and $2.2 billion in direct damage (NFPA, Fire Loss in the United States During 2024). Highway vehicles made up 84% of all 211,500 vehicle fires. That is about 487.7 highway vehicle fires a day. NFPA's estimate does not separate electric, hybrid and combustion vehicles.
The reason is the reporting system. NIST states that NFIRS was designed before lithium-ion batteries were common and has no fields that identify such fires (NIST TN 2365). Its replacement, NERIS, is being rolled out and is designed to identify lithium-ion fires, but NIST found too little NERIS data for analysis. In 2020 the NTSB evaluated 6 data sources on the prevalence of EV fires and found that all had serious limitations (NTSB/SR-20/01).
NIST worked around the gap by matching vehicle identification numbers in NFIRS against a news-based list of Tesla fires. It estimated 418 battery electric car fires and 800 plug-in car fires (battery electric plus plug-in hybrid) in the United States in 2023. Excluding Florida, which NIST considers unrepresentative, the estimates were 596 and 1,311. NFIRS itself identified only 119 plug-in fires by VIN in 2023, about 14.9% of the national estimate.
NIST puts growth in plug-in vehicle fires at about 45% a year and says this likely parallels the growth of the plug-in fleet. Because NIST does not divide by the fleet, its estimate cannot be turned into an official US rate per vehicle. Registration counts by state are covered in our EV charging stations and registrations by state report.
The '25 EV fires per 100,000' figure divides 52 fires by one year of EV sales
The US number that ranks in search results comes from an insurance comparison site. Its rates can be reproduced exactly from 2018 new-car sales, which means they are not rates per vehicle on the road.
AutoinsuranceEZ publishes a chart of 'Fires (per 100k Sales)': hybrid 3,474.5, gas 1,529.9 and electric 25.1, from totals of 16,051, 199,533 and 52 fires. The page says the fire counts came from NTSB data and the sales from the Bureau of Transportation Statistics. The only government page it links is a BTS sales table.
Dividing 52 fires by 25.1 per 100,000 gives 207,171 vehicles. BTS Table 1-19 (May 2021 edition, archived) lists 207,062 all-electric vehicles sold in 2018; 52 divided by 207,062 gives 25.11 per 100,000. The hybrid rate reproduces exactly: 16,051 divided by the 461,966 hybrids and plug-in hybrids sold in 2018 gives 3,474.5. The implied gas denominator is 13,042,225 vehicles.
| Fuel type in the chart | Fires shown | Fires per 100k sales shown | Implied denominator | BTS 2018 new sales | Recomputed rate per 100k sales |
|---|---|---|---|---|---|
| Electric | 52 | 25.1 | 207,171 | 207,062 | 25.11 |
| Hybrid (incl. plug-in hybrid) | 16,051 | 3,474.5 | 461,966 | 461,966 | 3,474.5 |
| Gas | 199,533 | 1,529.9 | 13,042,225 | not in Table 1-19 | not reproducible |
Implied denominator = fires shown divided by the rate shown, times 100,000. BTS Table 1-19 (May 2021 edition) does not list gasoline vehicle sales.
Source: [26][18] AutoinsuranceEZ; Bureau of Transportation Statistics (BTS), U.S. DOT
- What it measured: fires of unstated date and origin divided by one calendar year of new sales (2018), not by vehicles on the road.
- Why that matters: the gas and hybrid fleets on the road hold many years of sales, so dividing by one year of sales inflates their rates far more than the young EV fleet's.
- What it did not use: the NTSB's own 2020 safety report says the data sources it reviewed all had serious limitations in identifying battery fires.
Later restatements changed the wording. Kelley Blue Book (January 2022) kept 'per 100,000 sold'. electrive (January 2022) called the figures per 100k vehicles registered. Recurrent writes that gas cars saw fires in 1,530 out of 100,000 cars. A 2026 NIST literature review cites a figure of 0.03% for EV fires, attributed to another study; 25.1 per 100,000 equals 0.0251%, which rounds to the same value, though NIST does not say where that study's figure came from.
Fire-risk recalls: 125 EV and hybrid high-voltage campaigns among 1,115 since 2021
Recalls are the one US federal record that names fire and the recalled part. They measure defects that could cause fires, not fires that happened, and they cover potentially affected vehicles.
The Data Desk downloaded the NHTSA recalls flat file (dated 2026-11-03) and kept vehicle campaigns whose defect report was received from 2021-01-01 to 2026-10-28. Of 5,345 campaigns, 1,115 (20.9%) name fire in the consequence summary, covering 28,532,890 potentially affected vehicles.
NHTSA's file has no powertrain field, so campaigns were grouped by the recalled component. 125 fire campaigns (11.2%) involve EV or hybrid high-voltage parts, covering 1,375,832 vehicles (4.8%); 102 of them name the traction battery, covering 1,005,763 vehicles. 335 involve fuel system, engine or exhaust parts (10,357,983 vehicles), and 655 involve other parts such as wiring and 12 V batteries in vehicles of any powertrain (16,799,075 vehicles).
| Year received | All vehicle campaigns | Fire campaigns | Vehicles in fire campaigns | EV/hybrid high-voltage campaigns | EV/hybrid high-voltage vehicles | Fuel, engine or exhaust campaigns | Fuel, engine or exhaust vehicles | Other-component campaigns | Other-component vehicles | Fire campaigns with park-outside advice |
|---|---|---|---|---|---|---|---|---|---|---|
| 2021 | 988 | 221 | 3,244,680 | 3 | 114,524 | 102 | 791,294 | 116 | 2,338,862 | 11 |
| 2022 | 933 | 201 | 5,596,708 | 10 | 56,314 | 55 | 2,471,445 | 136 | 3,068,949 | 14 |
| 2023 | 894 | 190 | 8,395,339 | 26 | 276,193 | 49 | 807,791 | 115 | 7,311,355 | 20 |
| 2024 | 950 | 220 | 3,490,622 | 31 | 280,097 | 52 | 2,271,169 | 137 | 939,356 | 9 |
| 2025 | 891 | 157 | 3,688,299 | 34 | 460,361 | 46 | 2,389,662 | 77 | 838,276 | 17 |
| 2026 (to Oct 28) | 689 | 126 | 4,117,242 | 21 | 188,343 | 31 | 1,626,622 | 74 | 2,302,277 | 18 |
| Total | 5,345 | 1,115 | 28,532,890 | 125 | 1,375,832 | 335 | 10,357,983 | 655 | 16,799,075 | 89 |
Campaigns are vehicle recalls (Part 573 reports) received 2021-01-01 to 2026-10-28. Groups follow NHTSA component names: EV/hybrid high-voltage = ELECTRICAL SYSTEM: PROPULSION SYSTEM or HYBRID PROPULSION SYSTEM. Vehicles = potentially affected units, not fires.
Source: [5] National Highway Traffic Safety Administration (NHTSA), Office of Defects Investigation
Vehicle campaigns by year received; 2026 runs to October 28
Source: NHTSA recalls flat file FLAT_RCL_POST_2010 (file dated 2026-11-03); Data Desk classification by component
High-voltage fire campaigns rose from 3 in 2021 to 34 in 2025 as more EV and hybrid models reached the market. NHTSA attaches a 'park outside' advisory to the most serious fire recalls: 89 fire campaigns carried it, 31 of them for EV or hybrid high-voltage parts.
E-bike and e-scooter batteries: 277 fires in New York City in 2024 and 45 fire deaths known to CPSC nationally
In Sweden's 2024 count, e-scooters alone caused more fires than electric cars. New York City has the longest public series of lithium-ion battery fires, and national US counts are a floor.
The FDNY attributed 277 fires to lithium-ion batteries in 2024 and 268 in 2023 (FDNY, January 8, 2025). Deaths fell from 18 in 2023 to 6 in 2024. Earlier counts from the city were 44 fires in 2020, 104 in 2021 and 220 in 2022, with 0, 4 and 6 deaths (NYC Council Res. 0746-2023; NYC Mayor's Office, March 2023). The Public Advocate lists 30 fires and 13 injuries in 2019 (NYC Public Advocate, December 2024).
| Year | Lithium-ion battery fires | Structural | Non-structural | Deaths | Source |
|---|---|---|---|---|---|
| 2019 | 30 | not published | not published | 0 | Public Advocate (citing Gothamist) |
| 2020 | 44 | not published | not published | 0 | NYC Council Res. 0746-2023; Mayor's Office |
| 2021 | 104 | not published | not published | 4 | NYC Council Res. 0746-2023 |
| 2022 | 220 | not published | not published | 6 | NYC Council Res. 0746-2023; Mayor's Office |
| 2023 | 268 | 178 | 90 | 18 | FDNY, January 8, 2025 |
| 2024 | 277 | 144 | 133 | 6 | FDNY, January 8, 2025 (December 2025 release: 135 non-structural) |
| 2025 | not published | not published | not published | 1 (year to date at release) | FDNY 2025 end-of-year release |
Structural counts for 2023 and 2024 are total fires minus FDNY's non-structural count. No single FDNY table covers every year.
Source: [10][11][14][15][16] Fire Department of the City of New York (FDNY); Fire Department of the City of New York (FDNY); New York City Office of the Mayor; New York City Council; New York City Public Advocate
Fires attributed to lithium-ion batteries by FDNY
Source: FDNY (2023 to 2024), NYC Council Res. 0746-2023 and Mayor's Office (2020 to 2022), NYC Public Advocate (2019)
Deaths attributed to lithium-ion battery fires
Source: FDNY (2023 to 2024), NYC Council Res. 0746-2023 (2020 to 2022), NYC Public Advocate (2019)
More of these fires now happen outside homes. Non-structural fires were 90 of 268 in 2023 (33.6%) and 133 of 277 in 2024 (48.0%), leaving 178 and 144 structural fires. Deaths per 100 fires fell from 6.7 to 2.2. In the first three months of 2025, though, structural lithium-ion fires rose to 40 from 26 a year earlier, up 53% (FDNY, April 2, 2025). FDNY reported one death to the date of its FDNY 2025 end-of-year release.
Nationally, CPSC staff know of 533 micromobility deaths from 2017 to 2024, of which 45 (8.4%) involved fires: 19 e-bike, 15 e-scooter and 11 hoverboard deaths (CPSC, April 2026). Seven of the e-bike fire deaths involved homemade battery packs or bike repair shops. Fire was found in 367 of 531 CPSC in-depth investigations (69.1%), and in 62 of 106 e-bike fire investigations the fire started during charging.
| Product | All fatalities known to CPSC | Fire deaths | Fatal fire incidents | Investigations with fire hazard | All investigations |
|---|---|---|---|---|---|
| E-bikes | 310 | 19 | 13 | 106 | 145 |
| E-scooters | 206 | 15 | 11 | 88 | 189 |
| Self-balancing scooters (hoverboards) | 17 | 11 | 5 | 173 | 197 |
| All micromobility | 533 | 45 | 29 | 367 | 531 |
Fatal fire incidents for all micromobility are the sum of the three product rows. CPSC counts may rise as 2023 and 2024 reporting continues.
Source: [9] U.S. Consumer Product Safety Commission (CPSC)
By product
Source: U.S. Consumer Product Safety Commission, Micromobility Products-Related Deaths, Injuries, and Hazard Patterns 2017 to 2024 (April 2026)
The national count is a floor. New York City alone recorded 34 lithium-ion battery fire deaths from 2019 to 2024, equal to 75.6% of the 45 micromobility fire deaths CPSC counts nationwide for 2017 to 2024. The scopes differ (FDNY counts all lithium-ion battery fires), but the gap shows how many deaths never reach CPSC. In Sweden, e-scooters caused 78 of 174 electric vehicle fires in 2024, more than the 40 in cars (MSB, 19 May 2025).
Charging at home: what the NEC, product listings and NYC Local Law 39 require
Home charging risk is governed by installation code and product listing. Electric cars plug into listed equipment on a dedicated circuit; the e-bike problem in New York City led to a sales ban on uncertified batteries.
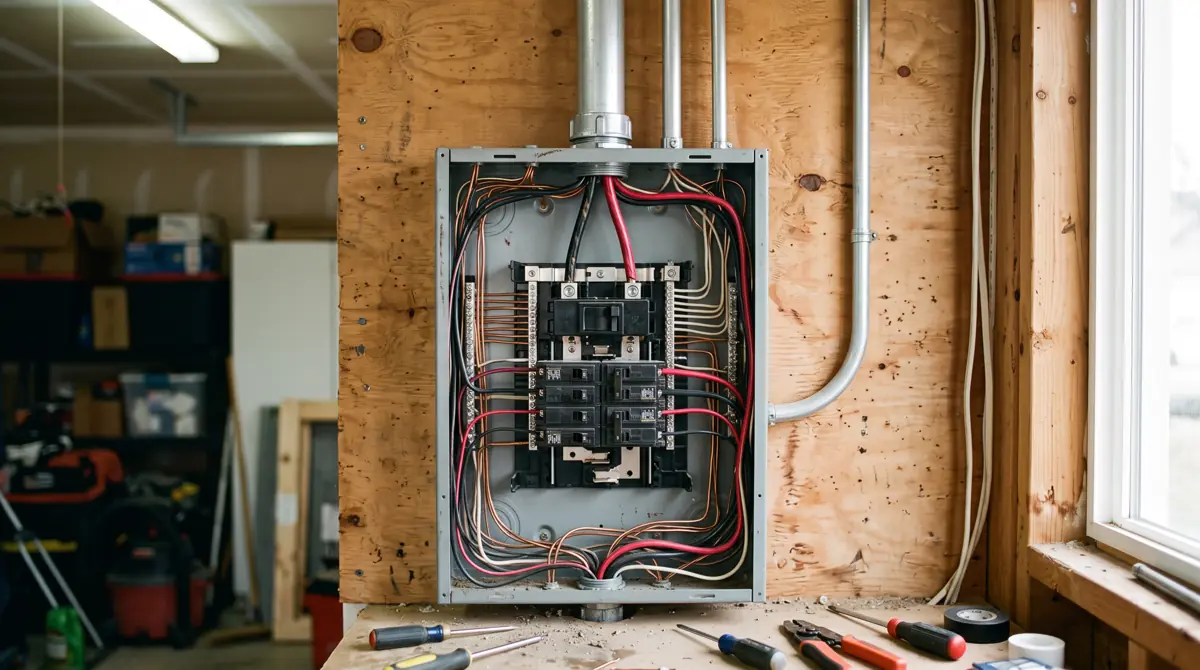
NEC Article 625 covers equipment that transfers power to and from electric vehicles. Under 625.40, each outlet installed for EV charging must be on an individual branch circuit with no other outlets, and EV charging counts as a continuous load, so overcurrent protection is sized at not less than 125% of the maximum load (EC&M on Article 625). Which NEC edition applies depends on the state: see NEC adoption by state and our code coverage.
| Rule or standard | What it covers | Why it matters for fire risk at home |
|---|---|---|
| NEC Article 625 (625.40) | EV power transfer equipment; each EV charging outlet on an individual branch circuit, overcurrent protection at 125% of maximum load | Charging is a continuous load; undersized circuits run hot |
| UL 2594 | AC EV supply equipment up to 1000 V ac, including cord sets (125 Vac, 16 A maximum) and wall-mounted stations | Listing for Level 1 and Level 2 home chargers |
| UL 2202 | DC charging equipment (input up to 1000 V ac or 1500 V dc) | DC fast chargers, rarely installed at homes |
| UL 9741 | Unidirectional and bidirectional EV power export equipment (1000 Vac and 1500 Vdc or less) | Vehicle-to-home and vehicle-to-grid equipment |
| UL 2849 | Electrical system of e-bikes: drive unit, battery, battery management system, wiring, charger | System-level listing for e-bikes |
| UL 2271 | Battery packs for light electric vehicles | Required for e-bike and e-scooter batteries sold in NYC |
| UL 2272 | Electrical drive train, battery and charger of personal e-mobility devices (e-scooters, hoverboards) | Required for e-scooters sold in NYC |
| NYC Local Law 39 of 2023 | Bans sale, lease or rental of e-bikes, e-scooters and their batteries without UL 2849, UL 2272 or UL 2271 certification | In force from 2023-09-16; first violation $0, later violations up to $1,000 |
Scope summaries only. Which NEC edition applies depends on state and local adoption.
Source: [17][19][20][21][22][23][24][25] City of New York (City Clerk), text served by intro.nyc; UL Standards & Engagement; UL Standards & Engagement; UL Standards & Engagement; UL Standards & Engagement; UL Standards & Engagement; UL Standards & Engagement; EC&M (Electrical Construction & Maintenance)
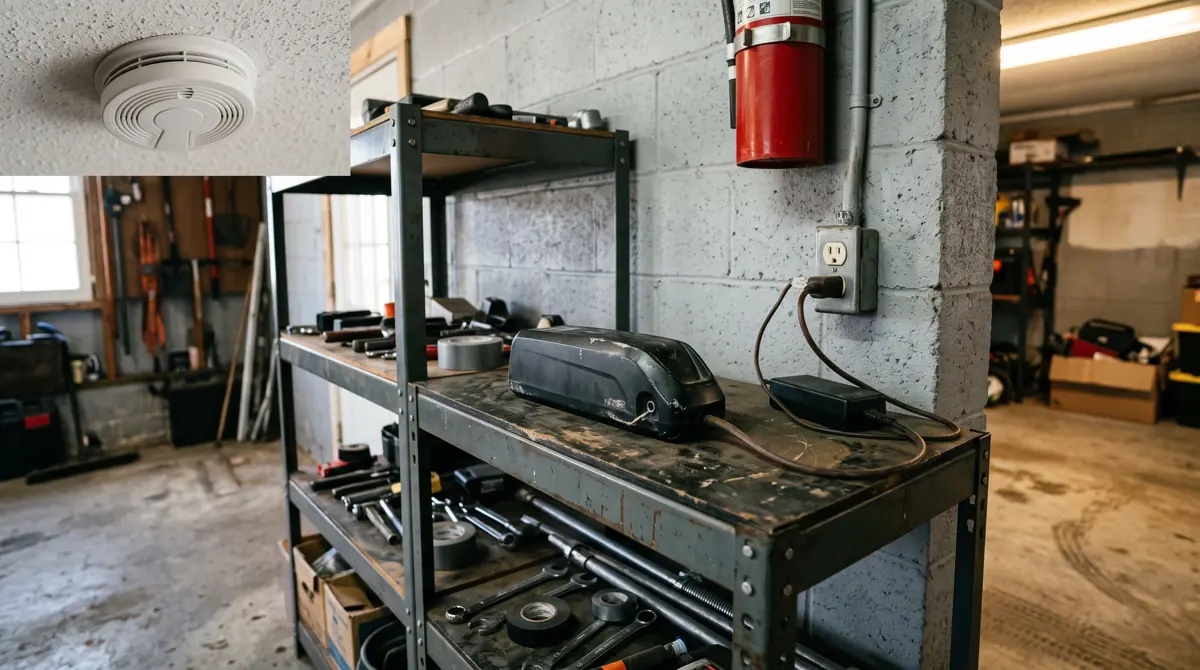
In New York City, Local Law 39 of 2023 bars the sale, lease or rental of e-bikes without UL 2849 certification, e-scooters without UL 2272 and their batteries without UL 2271. It was approved on 2023-03-20 and took effect 180 days later, on 2023-09-16. The first violation carries a $0 penalty and later violations within two years up to $1,000 per stock keeping unit.
What these electric car fire numbers cannot tell you
Every series here has a gap that limits comparison. The gaps are listed so the numbers are not quoted beyond what they support.
- No official US rate: NFPA and NFIRS do not split vehicle fires by powertrain; NIST's 2023 estimate is a model with a 95% interval of 362 to 1,732 plug-in fires.
- Nordic rates use fleets that differ in age and in how mild hybrids, arson and fires spreading to buildings are recorded.
- Small counts: Denmark's 2018 rate rests on 3 fires and 2019 on 10, so early rates swing widely.
- Recalls measure potential defects, not fires.
- FDNY and CPSC define lithium-ion and micromobility fires differently, and full-year 2025 counts were not published in the FDNY releases reviewed.
The record in numbers
- Denmark: 1.0 fire per 10,000 electric and hybrid cars in 2025, against 4.0 per 10,000 other cars (Beredskabsstyrelsen Faktaark 2026).[1]
- Denmark: fires in electric and hybrid cars rose from 50 in 2024 to 62 in 2025 (up 24%) while the fleet grew about 42% to just under 693,000.[1]
- Denmark: the EV and hybrid fire rate fell 79% from its 2019 peak of 4.8 per 10,000 to 1.0 in 2025; the other-car rate was 3.6 to 5.2 in every year.[1]
- Sweden 2024: 0.45 fires per 10,000 electric and hybrid cars vs 7.50 for other cars, a ratio of 16.7 that is inflated by arson in the other-car count.[1][4]
- Norway 2025: 0.55 fires per 10,000 electric and hybrid cars vs 3.90 for other cars, from DSB data compiled by BRS.[1]
- United States 2024: an estimated 178,500 highway vehicle fires caused 450 civilian deaths, with no split by fuel or powertrain (NFPA).[6]
- United States 2023: NIST estimated 800 plug-in car fires (95% interval 362 to 1,732) and 418 battery electric car fires; NFIRS identified 119 plug-in fires by VIN.[7]
- The '25 EV fires per 100,000' figure equals 52 fires divided by 207,062 EVs sold in 2018; its hybrid figure equals 16,051 divided by 461,966 hybrids and plug-in hybrids sold in 2018.[26][18]
- NHTSA, January 2021 to October 28, 2026: 1,115 of 5,345 vehicle recall campaigns (20.9%) name fire as a consequence, covering 28,532,890 vehicles.[5]
- NHTSA: 125 fire campaigns (11.2%) involve EV or hybrid high-voltage parts, covering 1,375,832 vehicles (4.8%); 102 of them name the traction battery.[5]
- NHTSA: EV and hybrid high-voltage fire campaigns rose from 3 in 2021 to 34 in 2025, while fuel, engine or exhaust fire campaigns fell from 102 to 46.[5]
- New York City: lithium-ion battery fires rose from 30 in 2019 to 277 in 2024; deaths peaked at 18 in 2023 and fell to 6 in 2024.[10][16]
- United States 2017 to 2024: CPSC knows of 45 micromobility fire deaths (19 e-bike, 15 e-scooter, 11 hoverboard) among 533 micromobility deaths.[9]
- CPSC: in 62 of 106 e-bike fire investigations (58.5%) the fire started while the e-bike was charging.[9]
Rates we calculated
Fire rate per 100,000 vehicles, EV and hybrid vs other cars, latest official year
Formulapublished rate per 10,000 x 10; ratio = other-car rate / EV and hybrid rate
Inputs: rows F16, F24, F30 to F33; D01, D02, D10 to D16 (fact sheet rows)
Result: Denmark 2025: 10.0 vs 40.0 (ratio 4.0); Sweden 2024: 4.5 vs 75.0 (16.7); Norway 2025: 5.5 vs 39.0 (7.1)
In all three countries with fleet denominators, electric and hybrid cars burn less often per registered vehicle than other cars.
Limitations: Different counting rules by country; age gap between fleets; arson included in Sweden's other-car figure.
Denmark trend in the EV and hybrid fire rate, 2018 to 2025
Formula(rate 2025 - rate 2019) / rate 2019; yearly ratio other / EV
Inputs: rows F09 to F24; D03 to D10, D19 (fact sheet rows)
Result: Rate fell 79% from 4.8 per 10,000 (2019) to 1.0 (2025); ratio rose from 1.1 to 4.0
As the Danish EV and hybrid fleet grew, fire counts rose but the rate per vehicle fell.
Limitations: Early years rest on 3 to 15 fires; BRS revises past values (2021 was 1.5 in the 2023 sheet, 1.7 in 2026).
NHTSA fire-risk recall campaigns by recalled component group, 2021 to October 2026
Formulacount distinct campaigns with 'fire' in the consequence summary, grouped by NHTSA component name; sum potentially affected units
Inputs: NHTSA FLAT_RCL_POST_2010 (s5); D29 to D44; table t3 (fact sheet rows)
Result: 125 EV/hybrid high-voltage campaigns (1,375,832 vehicles), 335 fuel/engine/exhaust (10,357,983), 655 other (16,799,075); total 1,115
High-voltage fire recalls are a small but growing share of fire recalls, from 3 campaigns in 2021 to 34 in 2025.
Limitations: No powertrain field; component grouping misses EV recalls for non-propulsion parts; recalls are not fires.
New York City lithium-ion battery fires and deaths, 2019 to 2024
Formulastructural = total - non-structural; deaths per 100 fires = deaths / fires x 100
Inputs: rows F87 to F98; D45, D47 to D53 (fact sheet rows)
Result: Fires grew 9.2 times from 30 (2019) to 277 (2024); structural fires 178 (2023) and 144 (2024); deaths per 100 fires 6.7 (2023) and 2.2 (2024)
Fire counts plateaued in 2023 to 2024 while deaths and indoor fires fell, consistent with FDNY's charge-outside messaging.
Limitations: 2019 count is second-hand; FDNY releases differ by 2 on 2024 non-structural fires; no full-year 2025 count published.
CPSC national micromobility fire deaths vs New York City alone
FormulaNYC deaths 2019 to 2024 / CPSC fire deaths 2017 to 2024
Inputs: rows F75, F87 to F95; D45, D46, D54 (fact sheet rows)
Result: 34 NYC deaths equal 75.6% of the 45 national fire deaths known to CPSC; fire is 8.4% of all micromobility deaths
CPSC's national fire death count is a floor, not an estimate of the total.
Limitations: FDNY counts all lithium-ion battery fire deaths; CPSC counts deaths linked to three product types known to its staff.
Trace of the '25 EV fires per 100,000' figure
Formulaimplied denominator = fires / rate x 100,000; compare to BTS 2018 sales
Inputs: rows F114 to F120; D23 to D28; table t6 (fact sheet rows)
Result: EV: 52 / 207,062 sold in 2018 = 25.11 per 100,000; hybrid: 16,051 / 461,966 = 3,474.5; gas denominator 13,042,225
The figure is a rate per vehicle sold in one year, built on fire counts with no stated source year, and is not comparable to fleet-based rates.
Limitations: The origin of the 16,051, 199,533 and 52 fire counts could not be verified.
What people search for
Do electric cars catch fire more than gas cars?
Not in the official data that exist. Denmark recorded 1.0 fire per 10,000 electric and hybrid cars in 2025 against 4.0 per 10,000 other cars, Sweden 0.45 against 7.50 (2024) and Norway 0.55 against 3.90 (2025). Gas cars in those fleets are older on average, and no US agency publishes a comparable rate.
How many EV fires happen each year?
In the US, NIST estimated 800 plug-in car fires in 2023, including 418 in battery electric cars, with wide uncertainty. Denmark counted 62 in 2025, Norway 75 in 2025, Sweden 40 in 2024 and the Netherlands 246 in 2025. For scale, NFPA estimates 178,500 US highway vehicle fires in 2024.
Are e-bike batteries dangerous?
Sweden's 2024 count recorded 78 e-scooter fires against 40 in electric cars. New York City recorded 277 lithium-ion battery fires and 6 deaths in 2024, and CPSC knows of 19 e-bike fire deaths nationwide from 2017 to 2024, 7 of them tied to homemade packs or repair shops. Certified batteries (UL 2271, UL 2849) are required for sale in New York City.
Is it safe to charge an EV in a garage?
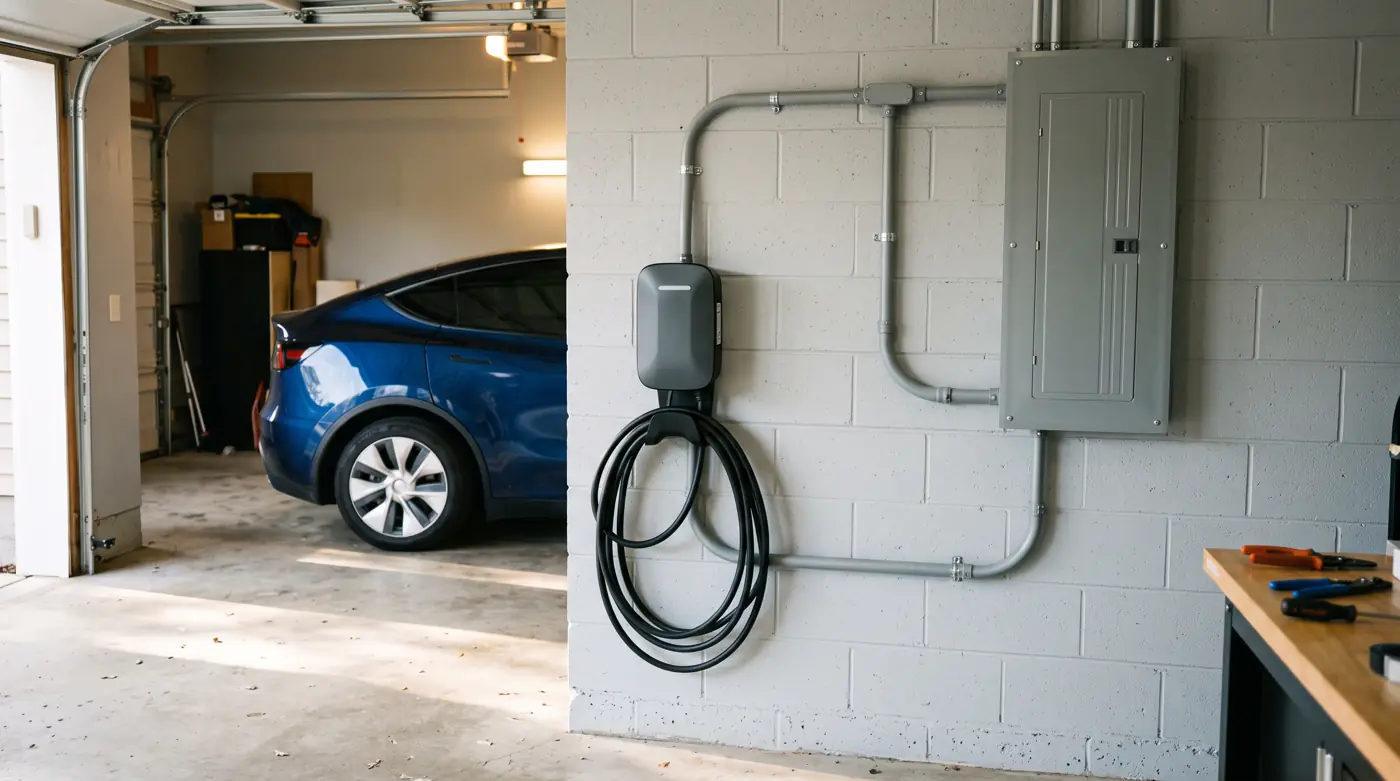
Charging is a minority of recorded EV fires: 4 of 76 Danish cases from 2018 to mid-2023 and 18 of 81 Swedish cases from 2018 to 2022. The code requires an individual branch circuit for EV outlets and listed equipment (UL 2594 for home chargers). A licensed electrician should size the circuit, and open recalls with a park-outside advisory should be followed.
In short
- Denmark's emergency management agency counted 62 fires in electric and hybrid cars in 2025, or 1.0 per 10,000 such cars, against 4.0 per 10,000 other cars.
- Sweden (2024: 0.45 vs 7.50 per 10,000) and Norway (2025: 0.55 vs 3.90 per 10,000) also show lower fire rates for electric and hybrid cars, with different counting rules.
- The United States has no official fire rate by powertrain: NFPA estimates 178,500 highway vehicle fires in 2024 without a fuel split, and NFIRS has no field for battery type.
- NIST estimated 800 plug-in car fires in the US in 2023 (95% interval 362 to 1,732), only about 1 in 10 of which NFIRS identifies by VIN.
- The widely shared '25 EV fires per 100,000' divides 52 fires by 207,062 EVs sold in 2018 (BTS), so it is a rate per vehicle sold in one year, not per vehicle on the road.
- Of 1,115 NHTSA vehicle recall campaigns since January 2021 that name fire, 125 involve EV or hybrid high-voltage parts, rising from 3 in 2021 to 34 in 2025.
- Micromobility batteries are the better documented lithium-ion fire problem: FDNY counted 277 lithium-ion battery fires and 6 deaths in 2024, after 18 deaths in 2023.
Common questions
How often do electric cars catch fire?
Denmark recorded 1.0 fire per 10,000 electric and hybrid cars in 2025, or 10 per 100,000. Sweden recorded 0.45 per 10,000 in 2024 and Norway 0.55 per 10,000 in 2025.
Where does the 25 per 100,000 EV fire statistic come from?
From AutoinsuranceEZ. It equals 52 fires divided by the 207,062 electric vehicles sold in the US in 2018, times 100,000, so it is per vehicle sold in one year, not per vehicle on the road.
Does the NTSB publish EV fire statistics?
No national series was found. The NTSB's 2020 safety report reviewed 6 data sources on EV fire prevalence and found that all had serious limitations, including identifying batteries as the source.
How many vehicle fires happen in the US each year?
NFPA estimates 211,500 vehicle fires in 2024, of which 178,500 were highway vehicle fires that caused 450 civilian deaths and $2.2 billion in damage. The estimate is not split by powertrain.
How many electric vehicles have been recalled for fire risk?
From January 2021 to October 28, 2026, NHTSA received 125 fire-consequence recall campaigns tied to EV or hybrid high-voltage parts, covering 1,375,832 potentially affected vehicles.
Are hybrids more likely to catch fire than EVs?
Official Nordic data group hybrids with electric cars, so they give no separate hybrid rate. The often-quoted hybrid figure of 3,474.5 per 100,000 is 16,051 fires divided by 461,966 hybrids and plug-in hybrids sold in 2018.
Why are EV fires hard to put out?
The NTSB found that damaged high-voltage batteries keep stranded energy, which can cause thermal runaway and reignition after a fire seems out, and can shock responders. It investigated 3 crash fires and 1 noncrash fire.
How many people die in e-bike battery fires?
CPSC knows of 19 e-bike fire deaths in the US from 2017 to 2024 and 45 across all micromobility products. New York City alone recorded 18 lithium-ion battery fire deaths in 2023 and 6 in 2024.
What does NYC Local Law 39 require?
Since 2023-09-16, e-bikes sold, leased or rented in New York City need UL 2849 certification, e-scooters UL 2272 and their batteries UL 2271. Repeat violations carry penalties up to $1,000.
What UL listing should a home EV charger have?
Home AC chargers and cord sets fall under UL 2594, which covers supply equipment up to 1000 V ac. Bidirectional vehicle-to-home equipment falls under UL 9741 and DC fast chargers under UL 2202.
Get the data
Every table in this report is available as a CSV under CC BY 4.0. The fact sheet lists each value with its source URL and access date.
- derived_metrics.csv (CSV)
- fact_sheet.csv (CSV)
- Fires per 100,000 cars: electric and hybrid vs other cars, latest official year (CSV)
- Denmark: fires in electric and hybrid cars and fire rates, 2018 to 2025 (CSV)
- NHTSA vehicle recall campaigns that name fire, by year received and recalled component group (CSV)
- New York City lithium-ion battery fires and deaths by year (CSV)
- US micromobility deaths and in-depth investigations involving fire, 2017 to 2024 (CSV)
- Tracing the '25 EV fires per 100,000' figure to its denominator (CSV)
- Rules and product standards that govern EV charging and e-bike batteries at home (CSV)
Cite this report
The figures to cite first
- Denmark recorded 1.0 fire per 10,000 electric and hybrid cars in 2025, against 4.0 per 10,000 other cars (Beredskabsstyrelsen, Faktaark 2026).[1]
- The '25 EV fires per 100,000' figure divides 52 fires by 207,062 electric vehicles sold in the US in 2018 (BTS Table 1-19), so it is not a rate per vehicle on the road.[26][18]
- Of 1,115 US vehicle recall campaigns from January 2021 to October 2026 that name fire, 125 involve EV or hybrid high-voltage parts (NHTSA recall data).[5]
Quotable figures
- Denmark recorded 1.0 fire per 10,000 electric and hybrid cars in 2025, against 4.0 fires per 10,000 other cars (Beredskabsstyrelsen, Faktaark 2026).[1]
- Sweden recorded 0.45 fires per 10,000 electric and hybrid cars in 2024, against 7.50 per 10,000 other cars, according to Beredskabsstyrelsen's comparison of Swedish agency data.[1]
- Norway recorded 0.55 fires per 10,000 electric and hybrid cars in 2025, against 3.90 per 10,000 other cars, according to Beredskabsstyrelsen's comparison of DSB data.[1]
- NIST estimated 800 fires in plug-in cars in the United States in 2023 (95% interval 362 to 1,732), in Technical Note 2365 published March 2026.[7]
- Of 1,115 US vehicle recall campaigns filed from January 2021 to October 28, 2026 that name fire as a consequence, 125 involve EV or hybrid high-voltage components (NHTSA recall data).[5]
- New York City recorded 277 lithium-ion battery fires and 6 deaths in 2024, after 268 fires and 18 deaths in 2023 (FDNY).[10]
- CPSC staff know of 45 fire deaths linked to e-bikes, e-scooters and hoverboards in the US from 2017 to 2024, out of 533 micromobility deaths.[9]
Summary for editors
Electric car fires are counted per vehicle by three Nordic agencies, and each shows a lower rate for electric and hybrid cars than for other cars. Denmark's Beredskabsstyrelsen recorded 1.0 fire per 10,000 electric and hybrid cars in 2025 against 4.0 per 10,000 other cars; Sweden's latest rate (2024) was 0.45 against 7.50 and Norway's (2025) 0.55 against 3.90. No US agency publishes a fire rate by powertrain. The US figure most often quoted, 25 EV fires per 100,000, traces to an insurance comparison site and divides 52 fires by the 207,062 EVs sold in 2018. NHTSA recall records show 125 fire-risk campaigns tied to EV or hybrid high-voltage parts since January 2021, among 1,115 fire campaigns. In Sweden, e-scooters caused 78 battery fires in 2024 against 40 in cars; New York City counted 277 lithium-ion battery fires in 2024, and CPSC knows of 45 micromobility fire deaths nationwide from 2017 to 2024.
Headlines the data supports
- Electric car fires: Nordic data show 1.0 fire per 10,000 EVs and hybrids vs 4.0 for other cars
- The '25 per 100,000' EV fire statistic divides by one year of 2018 sales
- 125 of 1,115 US fire recalls since 2021 involve EV or hybrid high-voltage parts
- New York City counted 277 lithium-ion battery fires in 2024
- No US agency publishes an electric car fire rate, NIST estimates 800 plug-in car fires in 2023
Citation
Electrical Contractors and Wiring. (2026). Electric car fires: official rates per vehicle, fire recalls and the lithium-ion battery problem. Retrieved from https://electricalcontractorsandwiring.com/data/electric-car-fires/
Reuse
Data and tables are licensed CC BY 4.0. Attribution: “Source: Electrical Contractors and Wiring, Electric car fires: official rates per vehicle, fire recalls and the lithium-ion battery problem” with a link to this page.
How we built this report
Source selection: we used agencies that publish both fires and the fleet they occur in (Beredskabsstyrelsen for Denmark, and its compilation of Swedish MCF and Norwegian DSB rates), official US fire statistics (NFPA, NFIRS through NIST), the NHTSA recalls flat file, CPSC's micromobility report and New York City government releases. Insurance and blog figures were treated as Tier 3 claims to trace, not as data.
Inclusion and exclusion: a figure was used only if the opened document states it. Search-result snippets, news counts without an agency source and figures from pages that blocked access are listed in excluded.md. The Norwegian rate is taken from BRS because the DSB statistics portal could not be opened.
Conflicts: where agency releases differ (FDNY's 133 and 135 non-structural fires in 2024; the Public Advocate's 267 and 264 fires against FDNY's 268 and 277), we used the FDNY primary release and noted the alternative. Danish values follow the 2026 fact sheet, which revises earlier sheets.
Derived metrics: per 100,000 rates are the published per 10,000 rates times 10. Recall counts come from scripts/nhtsa_fire_recalls.py, which keeps vehicle campaigns received from 2021-01-01, flags fire by keyword in the consequence summary and groups by NHTSA component name. Every formula is in derived_metrics.csv.
Limitations: there is no official US fire rate by powertrain; Nordic fleets differ in age; recall counts are not fire counts; CPSC and FDNY totals are floors that may rise as reporting continues. Data were accessed 2026-11-03 and 2026-11-05; this report was last updated 2026-11-05.
This report presents published data with its limitations. It is not legal, financial or investment advice.
Sources by tier
Tier 1: primary and official sources (18)
- [1] Beredskabsstyrelsen (Danish Emergency Management Agency, BRS). Faktaark 2026: Brande i el- og hybridbiler 2025. 2018 to 2025 (Denmark); 2024 Sweden; 2025 Norway and Netherlands. Accessed 2026-11-03.
- [2] Beredskabsstyrelsen (BRS). Faktaark 2024: Status på brande i el- og hybridbiler. 2018 to 2023. Accessed 2026-11-03.
- [3] Beredskabsstyrelsen (BRS). Faktaark 2023: Status på brande med el- og hybridbiler. January 2018 to June 2023. Accessed 2026-11-03.
- [4] Myndigheten för samhällsskydd och beredskap (MSB, now Myndigheten för civilt försvar). Ny sammanställning för bränder i elfordon och eltransportmedel (press release, 19 May 2025). 2023 and 2024 (Sweden). Accessed 2026-11-03.
- [5] National Highway Traffic Safety Administration (NHTSA), Office of Defects Investigation. Recalls flat file FLAT_RCL_POST_2010 and field definitions RCL.txt (file dated 2026-11-03). Part 573 reports received 2021-01-01 to 2026-10-28. Accessed 2026-11-03.
- [6] National Fire Protection Association (NFPA Research). Fire Loss in the United States During 2024, Shelby Hall, November 2025. 2024. Accessed 2026-11-05.
- [7] National Institute of Standards and Technology (NIST). NIST TN 2365: Understanding the Risk of Lithium-Ion Battery Fires, multi-source data analysis (March 2026). 2011 to 2023 (NFIRS and TeslaFires.com). Accessed 2026-11-05.
- [8] National Transportation Safety Board (NTSB). Safety Risks to Emergency Responders from Lithium-Ion Battery Fires in Electric Vehicles, NTSB/SR-20/01 (adopted November 13, 2020). Investigations 2017 to 2019. Accessed 2026-11-05.
- [9] U.S. Consumer Product Safety Commission (CPSC). Micromobility Products-Related Deaths, Injuries, and Hazard Patterns: 2017 to 2024 (April 2026). 2017 to 2024. Accessed 2026-11-05.
- [10] Fire Department of the City of New York (FDNY). FDNY Commissioner Robert S. Tucker Announces Significant Progress in the Battle Against Lithium-Ion Battery Fires (January 8, 2025). 2023 and 2024 (New York City). Accessed 2026-11-05.
- [11] Fire Department of the City of New York (FDNY). The FDNY Announces 2025 End-of-Year Accomplishments. 2023 to 2025 (2025 year to date at release). Accessed 2026-11-05.
- [12] Fire Department of the City of New York (FDNY). FDNY Releases New PSA to Remind New Yorkers to Store and Charge Lithium-Ion Batteries Outside (April 2, 2025). First three months of 2024 and 2025. Accessed 2026-11-05.
- [13] Fire Department of the City of New York (FDNY). 'These fires are treacherous': FDNY releases new PSA as lithium-ion batteries continue to pose a threat (July 9, 2025). July 2025. Accessed 2026-11-05.
- [14] New York City Office of the Mayor. Mayor Adams Announces Plan to Combat Lithium-Ion Battery Fires, Promote Safe Electric Micromobility Usage (March 2023). 2020 to 2022 (New York City). Accessed 2026-11-05.
- [15] New York City Council. Res. 0746-2023 (legislation text). 2020 to 2022 (New York City). Accessed 2026-11-05.
- [16] New York City Public Advocate. Stopping the Blaze: Solutions for Safe Use of Lithium-Ion Batteries (December 2024). 2019 to 2024 (New York City; 2024 through December 4). Accessed 2026-11-05.
- [17] City of New York (City Clerk), text served by intro.nyc. Local Law No. 39 of 2023 (Int. No. 663-A of 2022), certified text. Passed March 2, 2023; approved March 20, 2023. Accessed 2026-11-05.
- [18] Bureau of Transportation Statistics (BTS), U.S. DOT. Table 1-19: Hybrid-Electric, Plug-in Hybrid-Electric and Electric Vehicle Sales (May 2021 edition, Internet Archive copy; bts.gov returned 403). 2000 to 2020 sales. Accessed 2026-11-03.
Tier 2: trade bodies, market research, company data (6)
- [19] UL Standards & Engagement. UL 2594: Standard for Electric Vehicle Supply Equipment (scope). Current edition. Accessed 2026-11-05.
- [20] UL Standards & Engagement. UL 9741: Standard for Electric Vehicle Power Export Equipment (scope). Current edition. Accessed 2026-11-05.
- [21] UL Standards & Engagement. UL 2849: Standard for Electrical Systems for eBikes (scope). Current edition. Accessed 2026-11-05.
- [22] UL Standards & Engagement. UL 2271: Standard for Batteries for Use in Light Electric Vehicle (LEV) Applications (scope). Current edition. Accessed 2026-11-05.
- [23] UL Standards & Engagement. UL 2272: Standard for Electrical Systems for Personal E-Mobility Devices (scope). Current edition. Accessed 2026-11-05.
- [24] UL Standards & Engagement. UL 2202: Standard for DC Charging Equipment for Electric Vehicles (scope). Current edition. Accessed 2026-11-05.
Tier 3: journalism and expert commentary (5)
- [25] EC&M (Electrical Construction & Maintenance). The Apprentice's Guide to Article 625, Harold De Loach (November 9, 2023). NEC Article 625 commentary. Accessed 2026-11-05.
- [26] AutoinsuranceEZ. Gas vs. Electric Car Fires (page updated September 2024; chart image uploaded August 2021). Not stated (claim traced, not endorsed). Accessed 2026-11-03.
- [27] Kelley Blue Book. Study: Electric Vehicles Involved in Fewest Car Fires, Sean Tucker (January 28, 2022; Internet Archive copy, kbb.com returned 403). Repeats AutoinsuranceEZ figures. Accessed 2026-11-05.
- [28] electrive.com. Fire statistics confirm EVs are safer, Chris Randall (January 19, 2022; Internet Archive copy, electrive.com returned 403). Repeats AutoinsuranceEZ figures. Accessed 2026-11-05.
- [29] Recurrent. Do EVs Catch Fire a Lot?. Repeats AutoinsuranceEZ figures. Accessed 2026-11-05.