Transformer Shortage: Prices, Lead Times, Imports and Policy in Federal Data, 2019 to 2026
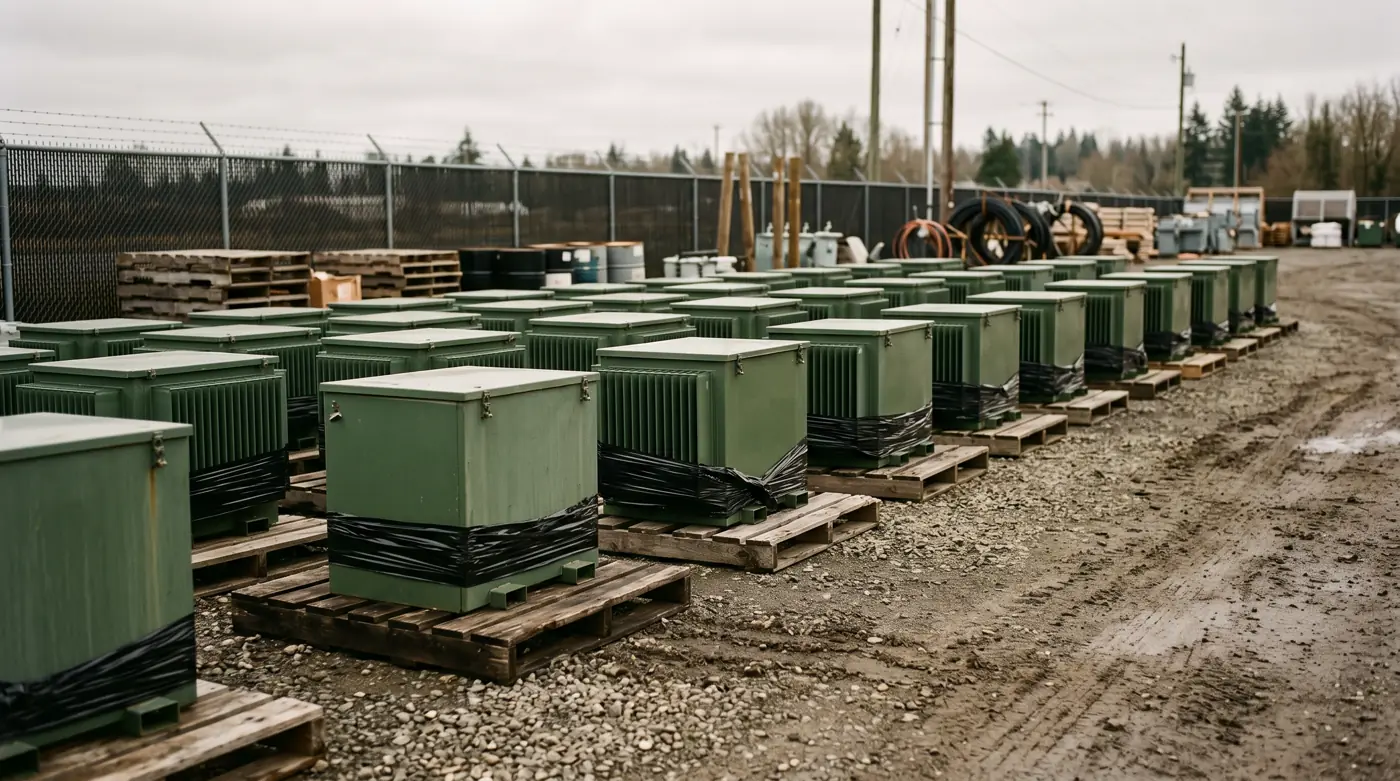
- Data
- BLS Producer Price Index WPU117409 and PCU335311335311; UN Comtrade US imports HS 8504.21 to 8504.23 (CIF and customs value)
- Period
- January 2018 to September 2026 (PPI); 2018 to August 2026 (imports)
- Release used
- 2026-10-15
- Next release
- 2026-11-13 (PPI for October 2026); UN Comtrade September 2026 trade data not yet posted
- Geography
- United States
- Sources
- 40 (32 official)
The transformer shortage has eased for smaller distribution units but has not ended. The federal price index for power and distribution transformers was 91.4% above January 2020 in July 2026, US imports reached $7.7 billion in 2025, and published lead times still run from 30 weeks to about four years.
Transformer prices are up 91.4% since January 2020 on the federal index
The Bureau of Labor Statistics index for power and distribution transformers nearly doubled between January 2020 and July 2026. Most of the jump came in 2021 and 2022; since January 2023 the climb has been slower but has not reversed.
The producer price index for power and distribution transformers, except parts (BLS series WPU117409), stood at 381.8 in July 2026 (preliminary), against 199.5 in January 2020: a rise of 91.4% (BLS PPI commodity file).
The index rose 65.1% between January 2020 and January 2023, then a further 15.9% between January 2023 and July 2026. By January 2023, 71.2% of the total index-point rise since January 2020 had already happened.
The industry index for electric power and specialty transformer manufacturing (PCU335311335311) reached 475.1 in September 2026 (preliminary), 85.9% above January 2020 and 7.8% above September 2025 (BLS PPI industry file). The broader transformers and power regulators index (WPU1174) is up 84.2% over the same span.
| Series | Jan 2020 | Jan 2023 | Latest month | Latest value | Change since Jan 2020 % | 12-month change % |
|---|---|---|---|---|---|---|
| Power and distribution transformers, except parts (commodity, WPU117409) | 199.5 | 329.3 | Jul 2026 (P) | 381.8 | 91.4 | 8.7 |
| Electric power and specialty transformer manufacturing (industry, PCU335311335311) | 255.5 | 410.6 | Sep 2026 (P) | 475.1 | 85.9 | 7.8 |
| Transformers and power regulators (commodity, WPU1174) | 235.9 | 376.1 | Sep 2026 (P) | 434.5 | 84.2 | 7.6 |
| Other transformers and parts (commodity, WPU117411) | 154.5 | 216.6 | Sep 2026 (P) | 245.6 | 59.0 | 2.5 |
Not seasonally adjusted. (P) = preliminary. WPU117409 had no published August or September 2026 value at access.
Source: [1][2] U.S. Bureau of Labor Statistics; U.S. Bureau of Labor Statistics
BLS producer price indexes, not seasonally adjusted (each series on its own base)
Source: U.S. Bureau of Labor Statistics, PPI flat files wp.data.12c and pc.data.21 (accessed 2026-11-02)
Annual averages tell the same story: the power and distribution transformer index averaged 195.4 in 2019 and 352.9 in 2025, a rise of 80.6%. The 12-month change to July 2026 was 8.7%, so prices are still rising faster than the pre-2020 trend.
Copper and electrical steel drive much of the materials cost. Copper prices are tracked separately in our copper wire price index; this report does not repeat them.
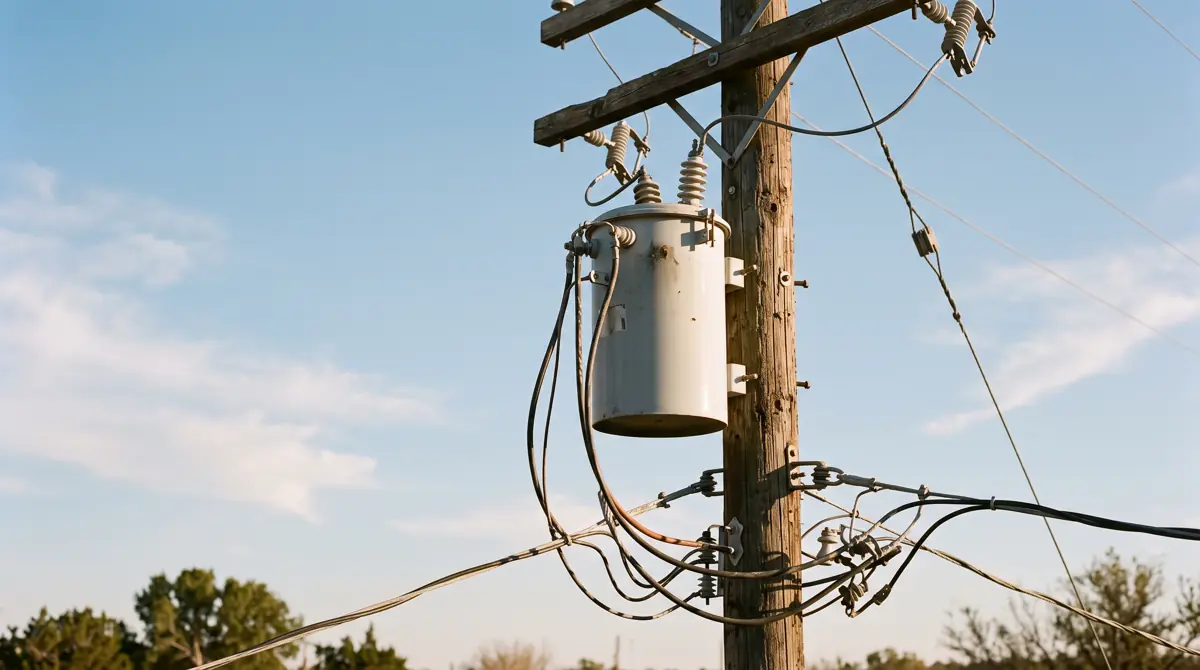
How long are transformer lead times? Every dated public figure, with its source
Public records show lead times rising two to five times from pre-2021 norms, peaking around 2023 and 2024. The most recent public figure for distribution units, 30 weeks in the second quarter of 2025, comes from a consultancy as cited by CRS; large power transformers still run two to four years.
We collected every dated lead-time figure we could open and verify, and labelled each by evidence type. Federal and utility records sit next to commenter claims and consultancy estimates so readers can see where each number comes from.
| Date published | Source | Transformer class | Lead time as stated | Evidence type | Tier |
|---|---|---|---|---|---|
| 2014-04 | DOE, Large Power Transformers and the U.S. Electric Grid | Large power | 5 to 12 months domestic, 6 to 16 months foreign (2010 average) | Federal report | 1 |
| 2022-10 | APPA distribution transformer survey (95 utilities) | Distribution | About 2 to 3 months pre-2021 to about 12 months in 2022; some quotes over 3 years | Association survey | 2 |
| 2023-11 | Wood Mackenzie public summary | All, large units | Around 50 weeks (2021) to 120 weeks (2024); large units 80 to 210 weeks | Consultancy summary | 3 |
| 2023-12 | NERC 2023 Long-Term Reliability Assessment | Distribution | Often exceed two years | Reliability regulator report | 1 |
| 2023-12 | NERC 2023 LTRA, WECC-NW | Transmission | Three years; breakers 85 weeks | Reliability regulator report | 1 |
| 2023-12 | NERC 2023 LTRA, WECC-CA/MX | Transformers and breakers | 75 to 80 weeks vs 24 weeks before Covid-19 | Reliability regulator report | 1 |
| 2024-02 | NREL, Major Drivers of Long-Term Distribution Transformer Demand | Distribution | Up to 2 years, fourfold pre-2022 | Federal lab report | 1 |
| 2024-02 | Rhode Island Energy data response, RIPUC Docket 23-48-EL | Substation | 32 to 44 weeks to 104 to 156 weeks | Utility regulatory filing | 1 |
| 2024-04 | DOE final rule, comment from NEPPA | Distribution (public power) | Upwards of 188 weeks | Commenter claim in federal rule | 1 |
| 2024-04 | DOE final rule, comment from Eaton | Distribution | 2 to 4 years liquid-immersed; up to 18 months LVDT | Commenter claim in federal rule | 1 |
| 2024-04 | DOE final rule, comment from SolaHD | Distribution | Over 16 months MV/HV; 6 to 8 weeks LVDT | Commenter claim in federal rule | 1 |
| 2024-06 | NIAC report (draft posted by CISA) | All | 2 to 4 years vs months in 2020; one plant quoted 5 years | Federal advisory council | 1 |
| 2025-01 | SMUD board exhibit | Distribution | 16 to 20 weeks before 2020; more than 52 weeks in 2024 to 2025; 30 to 50 weeks targeted | Public utility record | 1 |
| 2026-03 | DOE Distribution Transformer Convening Webinar | Distribution; large | 3 to 6 months (2019) to 1 to 2 years or longer (2024); large 3 to 4 years | Federal agency statement | 1 |
| 2026-04 | CRS R48933 citing Wood Mackenzie | Distribution | 30 weeks by Q2 2025 | Congressional research citing consultancy | 1 |
| 2026 | POWER magazine citing Wood Mackenzie Q2 2025 survey | Power, GSU | 128 weeks power; 144 weeks GSU | Trade press | 3 |
| 2026-05 | pv magazine USA citing PwC via Reuters Events | High-capacity | As long as four years | Trade press | 3 |
Tier: 1 federal, regulator or public-utility record; 2 trade association; 3 consultancy or trade press. Commenter claims in the DOE rule are stakeholder statements, not DOE measurements.
Source: [14][16][18][19][20][21][23][24][7][27][29][31][32] National Renewable Energy Laboratory (now National Laboratory of the Rockies); President's National Infrastructure Advisory Council, posted by CISA; U.S. Department of Energy, Office of Electricity Delivery and Energy Reliability; Congressional Research Service; North American Electric Reliability Corporation; U.S. Department of Energy; Sacramento Municipal Utility District; The Narragansett Electric Company d/b/a Rhode Island Energy; U.S. Department of Energy; American Public Power Association; Wood Mackenzie; POWER magazine; pv magazine USA
Midpoints of stated ranges, converted to weeks
Sources: SMUD (2025), Rhode Island Energy RIPUC filing (2024), APPA (2022), DOE (2026), Wood Mackenzie (2023); midpoints by ECW
The pre-shortage baseline is well documented. In 2010, the average large power transformer lead time was 5 to 12 months from domestic producers and 6 to 16 months from foreign producers (DOE, 2014). Public power utilities reported distribution transformer lead times of about 2 to 3 months before 2021 (APPA, 2022).
Utility records give the clearest dated evidence. The Sacramento Municipal Utility District told its board in January 2025 that distribution transformer lead times moved from 16 to 20 weeks before 2020 to more than 52 weeks in 2024 to 2025 (SMUD board exhibit). Rhode Island Energy told state regulators in February 2024 that substation transformer lead times had increased from 32 to 44 weeks to 104 to 156 weeks (RIPUC Docket 23-48-EL).
Federal statements line up with those records. DOE said at a March 5, 2026 convening that distribution transformer lead times went from 3 to 6 months in 2019 to 1 to 2 years or longer in 2024, and that large substation and generator transformers take 3 to as much as 4 years (DOE transcript). NERC's December 2023 assessment said distribution transformer lead times often exceed two years.
Lead time: The time from a purchase order to delivery of a finished transformer. It is not the factory build time: DOE's 2022 review found an LPT takes 12 to 16 weeks to manufacture when all materials are on hand.
Our conversion of each record to weeks shows the later figure running 2.4 to 4.8 times the earlier one. These are midpoints of stated ranges; the method is in the derived metrics file.
US imports of liquid-filled transformers grew 4.9 times between 2019 and 2025
Imports under HS 8504.21 to 8504.23 rose from $1.6 billion in 2019 to $7.7 billion in 2025. Mexico is still the largest source, but its share fell as South Korea and Brazil gained. Federal estimates put domestic production at about 20% of large power transformer demand, while CRS cites 25% to 30% of finished distribution units as imported.
Combined US imports of liquid-dielectric transformers (HS 8504.21, 8504.22 and 8504.23) were $1,552.7 million in 2019 and $7,672.0 million in 2025, a rise of 394.1% in nominal dollars (UN Comtrade, US-reported data). The 2025 total was 27.2% above 2024. At customs value, the basis Census uses for headline import figures, the totals were $1,529.9 million in 2019 and $7,499.7 million in 2025, up 390.2% (4.9 times). CIF ran 2.3% above customs value in 2025 (UNSD note on US valuation).
CIF value and customs value: Customs value is the price paid for the goods, excluding US import duties, freight and insurance. CIF value adds freight and insurance to the first US port. UN Comtrade carries both for US imports; the Census Bureau's own trade API needs a key, so the customs values here come from UN Comtrade's FOB field, which the UN country note for the United States equates with customs value.
| HS code | 2019 value $M | 2025 value $M | Value change % | 2019 units | 2025 units | Unit change % | 2019 $ per unit | 2025 $ per unit | 2025 customs value $M | CIF above customs % |
|---|---|---|---|---|---|---|---|---|---|---|
| 8504.21 (liquid dielectric, up to 650 kVA) | 298.2 | 1,384.1 | 364.2 | 206,348 | 350,368 | 69.8 | 1,445 | 3,951 | 1,359.6 | 1.8 |
| 8504.22 (liquid dielectric, over 650 kVA to 10,000 kVA) | 281.5 | 2,142.7 | 661.2 | 8,242 | 47,509 | 476.4 | 34,152 | 45,100 | 2,108.4 | 1.6 |
| 8504.23 (liquid dielectric, over 10,000 kVA) | 973.1 | 4,145.3 | 326.0 | 1,206 | 5,021 | 316.3 | 806,847 | 825,583 | 4,031.7 | 2.8 |
| All three codes | 1,552.7 | 7,672.0 | 394.1 | 7,499.7 | 2.3 |
Value columns 2019 and 2025 are CIF (customs value plus freight and insurance). Customs value is UN Comtrade's FOB field for US imports, which the UN country note for the United States defines as the Census customs value. Units as reported; per-unit values are simple averages across very different sizes.
Source: [5][38] United Nations Statistics Division, data reported by the U.S. Census Bureau; United Nations Statistics Division
HS 8504.21 to 8504.23, US$ millions, CIF basis
Source: UN Comtrade, US-reported imports (U.S. Census Bureau data), accessed 2026-11-02
The mid-size class (8504.22, over 650 kVA to 10,000 kVA), which covers large pad-mount and substation distribution units, grew fastest: value up 661.2% and units up 476.4%, from 8,242 units in 2019 to 47,509 in 2025. Units over 10,000 kVA rose from 1,206 to 5,021, while their average import value per unit moved only from $806,847 to $825,583.
Unit growth matters as much as price here. For the largest class, units rose 316.3% while value rose 326.0%, so the import surge is mostly more transformers, not just dearer ones. For the smallest class (8504.21, up to 650 kVA), the average value per unit rose from $1,445 to $3,951, which mixes real price increases with a shift toward larger ratings.
| Country | 2019 value $M | 2019 share % | 2025 value $M | 2025 share % |
|---|---|---|---|---|
| Mexico | 632.6 | 40.7 | 2,164.4 | 28.2 |
| South Korea | 147.6 | 9.5 | 1,651.4 | 21.5 |
| Brazil | 25.8 | 1.7 | 674.8 | 8.8 |
| Canada | 169.0 | 10.9 | 493.2 | 6.4 |
| Austria | 220.8 | 14.2 | 454.5 | 5.9 |
| Netherlands | 92.1 | 5.9 | 260.4 | 3.4 |
Combined HS 8504.21, 8504.22 and 8504.23. Taiwan appears as 'Other Asia, nes' in UN Comtrade and is outside the top six.
Source: [5] United Nations Statistics Division, data reported by the U.S. Census Bureau
Share of combined HS 8504.21 to 8504.23 import value, percent
Source: UN Comtrade, US-reported imports, 2025, accessed 2026-11-02
In 2025 the top five source countries supplied 70.9% of import value: Mexico 28.2%, South Korea 21.5%, Brazil 8.8%, Canada 6.4% and Austria 5.9%. In 2019 Mexico alone supplied 40.7% and Brazil 1.7%.
The most recent months show imports levelling off. January to August 2026 imports were $5,235.2 million, 2.5% above the same months of 2025. Imports of the largest class rose 9.8%, while the two smaller classes combined fell 6.0%. At customs value, January to August 2026 imports were $5,137.7 million, 3.1% above the $4,981.4 million of the same months of 2025.
US$ millions, CIF basis, not seasonally adjusted
Source: UN Comtrade, US-reported monthly imports, accessed 2026-11-02
| Period | 8504.21 $M | 8504.22 $M | 8504.23 $M | Total $M |
|---|---|---|---|---|
| 2018 | 283.9 | 221.5 | 872.1 | 1,377.5 |
| 2019 | 298.2 | 281.5 | 973.1 | 1,552.7 |
| 2020 | 347.5 | 345.7 | 1,147.5 | 1,840.8 |
| 2021 | 373.7 | 376.6 | 1,069.6 | 1,819.9 |
| 2022 | 584.0 | 631.1 | 1,258.1 | 2,473.2 |
| 2023 | 1,080.0 | 1,046.2 | 1,926.8 | 4,053.0 |
| 2024 | 1,598.6 | 1,452.6 | 2,978.3 | 6,029.5 |
| 2025 | 1,384.1 | 2,142.7 | 4,145.3 | 7,672.0 |
| Jan to Aug 2025 | 952.2 | 1,413.8 | 2,742.7 | 5,108.7 |
| Jan to Aug 2026 | 815.4 | 1,408.8 | 3,010.9 | 5,235.2 |
2026 data run through August, the latest month available at access.
Source: [5][6] United Nations Statistics Division, data reported by the U.S. Census Bureau; United Nations Statistics Division, data reported by the U.S. Census Bureau
Domestic capacity figures come from federal reports. DOE estimated in its April 2024 rule that 85% of liquid-immersed distribution transformer manufacturing, 15% of low-voltage dry-type and 75% of medium-voltage dry-type takes place in the US (89 FR 29834). CRS cites a 2023 estimate that 25% to 30% of finished distribution transformers are imported. For large power transformers, DOE found 82% of 2019 US consumption was imported, and NIAC's final June 2024 report put domestic supply at 20% of demand.
| Measure | Figure | Source |
|---|---|---|
| Distribution transformers in service | 60 to 80 million | NREL, Nov 2024 |
| Share older than 33 years | about 50% to 55% | NREL, Nov 2024 |
| Units added or replaced per year | 1.5 to 2.4 million (62.5 to 105 GW) | NREL, Nov 2024 |
| 2050 in-service capacity requirement | 160% to 260% of 2021 level | NREL, Nov 2024 |
| Units beyond expected design life | around 17.5 million | DOE webinar (NLR presenter), Mar 2026 |
| Distribution transformers shipped | 1.5 million (2021) | DOE via CRS, Apr 2026 |
| US distribution transformer OEMs | 34 (Apr 2024) | DOE via CRS, Apr 2026 |
| Finished distribution transformers imported | 25% to 30% (2023 estimate) | CRS, Apr 2026 |
| Liquid-immersed distribution manufacturing done in US | 85% | DOE final rule, Apr 2024 |
| Low-voltage dry-type manufacturing done in US | 15% | DOE final rule, Apr 2024 |
| Large power transformers imported | 82% (2019) | DOE supply chain review, Feb 2022 |
| Large power transformer demand met domestically | 20% (2024) | NIAC, Jun 2024 |
| US large power transformer output | 122 to 153 units a year (2015 to 2019) | DOE supply chain review, Feb 2022 |
Estimates, not census counts. NREL is now the National Laboratory of the Rockies (NLR).
Source: [15][17][7][16][19][21] National Renewable Energy Laboratory (now National Laboratory of the Rockies); U.S. Department of Energy; U.S. Department of Energy; President's National Infrastructure Advisory Council, posted by CISA; Congressional Research Service; U.S. Department of Energy
Why is there a transformer shortage? Aging units, new load and electrification
Federal lab estimates put 60 to 80 million distribution transformers in service, about half older than 33 years, with 1.5 to 2.4 million added or replaced each year. NREL projects the capacity needed in 2050 at 160% to 260% of the 2021 level.
NREL estimates 60 to 80 million distribution transformers in service in the US, with 2.5 to 3.5 TVA of capacity, and that about 50% to 55% are older than 33 years (NREL, November 2024). A DOE-hosted presentation by the laboratory in March 2026 put the number beyond expected design life at around 17.5 million.
Replacement already drives most purchases. A DOE speaker said in March 2026 that about two-thirds of new transformers go to planned replacements. NREL estimates 1.5 to 2.4 million units are added or replaced each year, equal to 62.5 to 105 GW of demand.
New load adds to that base. NREL projects about 2 TW of step-up transformer capacity for wind and solar by 2050, up to 477 GW of AC EV charging port capacity by 2050, and 12.6 to 72 GW of data center transformer capacity for power delivery units by 2030.
Distribution transformer: Under 10 CFR 431.192, a transformer with input of 34.5 kV or less, output of 600 V or less, rated 10 kVA to 5000 kVA (liquid-immersed) or 15 kVA to 5000 kVA (dry-type). Large power transformers serve transmission voltages above 34.5 kV.
Variety slows production. A DOE presentation in November 2024 counted at least 79,421 different types of distribution transformers across 2,938 utilities (DOE presentation). Outage restoration also draws on the same stock; outage counts are in our power outages by state report.
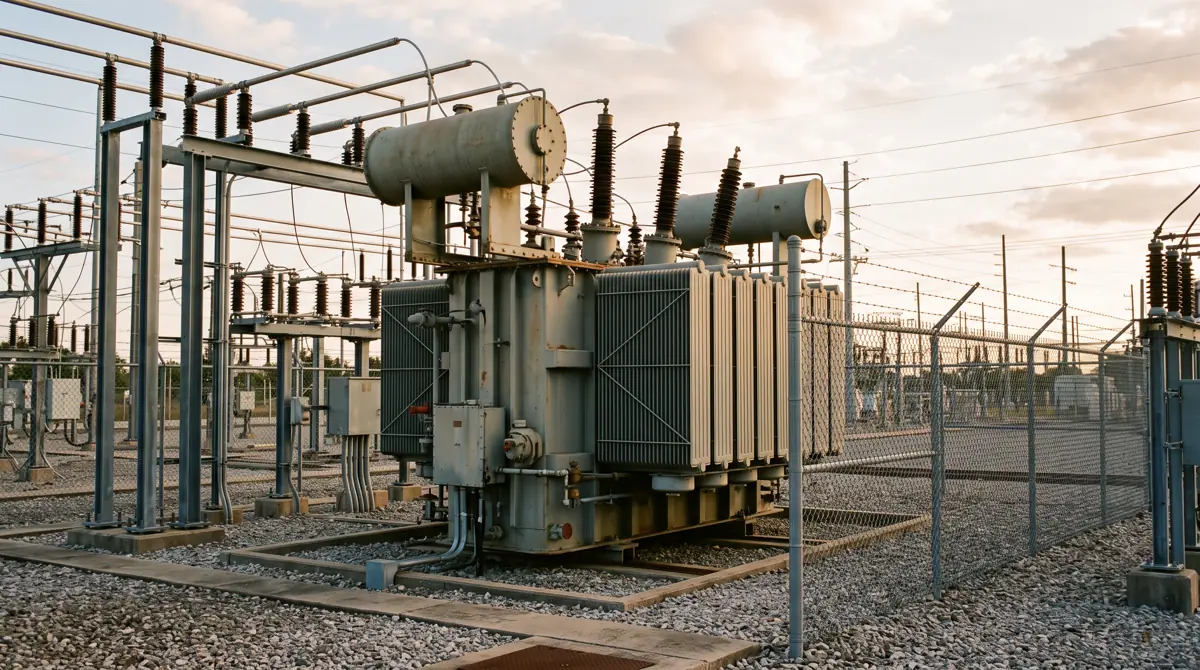
Federal policy: a 2029 efficiency deadline under review and two defense determinations
DOE's 2024 efficiency standard requires compliance from April 23, 2029, and DOE opened a review of it in June 2026. Defense Production Act determinations in 2022 and 2026 named transformers as essential. Since April 6, 2026, Section 232 duties cover all three liquid-filled transformer lines at full value.
| Date | Agency | Action | Citation |
|---|---|---|---|
| 2012-08-31 | Commerce | Antidumping duty order on large power transformers from South Korea | 77 FR 53177 (cited in 89 FR 72373) |
| 2022-06-06 | President | DPA Presidential Determination 2022-19 on transformers and grid components | 87 FR 35079 |
| 2024-04-22 | DOE | Final rule: amended distribution transformer efficiency standards, compliance 2029-04-23 | 89 FR 29834 |
| 2024-08-27 | Commerce | Antidumping order on large power transformers from South Korea continued after sunset review | 89 FR 72373 |
| 2025-08-18 | Commerce (BIS) | Section 232 steel derivative duties extended to HTSUS 8504.23.00 and three core and lamination lines (steel content only) | 90 FR 40326 |
| 2026-04-06 | President | Proclamation 11021: Section 232 duty on full value; 8504.21.00 and 8504.22.00 at 25% (Annex I-B); 8504.23.00 at 15% total until 2027-12-31 (Annex III) | 91 FR 18201 |
| 2026-04-20 | President | DPA Presidential Determination 2026-10 on grid infrastructure, naming transformers and electrical core steel | 91 FR 21931 |
| 2026-06-08 | President | Proclamation 11032: annexes republished, transformer placements unchanged | 91 FR 34085 |
| 2026-06-15 | DOE | Request for information on the 2024 standards and national security; comments due 2026-07-15 | 91 FR 35903 |
| 2026-11-02 | Commerce | Preliminary results of the 2024 to 2025 antidumping review on Korean large power transformers | 91 FR 68940 |
Neutral record of published actions; each links to its Federal Register document in the references.
Source: [7][8][9][10][11][12][13] U.S. Department of Energy; U.S. Department of Energy; Executive Office of the President; Executive Office of the President; U.S. Department of Commerce, Bureau of Industry and Security; U.S. Department of Commerce, International Trade Administration; U.S. Department of Commerce, International Trade Administration
DOE's April 22, 2024 final rule sets amended efficiency standards for distribution transformers manufactured in or imported into the US from April 23, 2029. DOE estimated 4.58 quads of full-fuel-cycle energy savings over 30 years of shipments and one-time industry conversion costs of $228.8 million in total. For liquid-immersed units, DOE put consumer net present value at $0.56 billion to $3.41 billion.
On June 15, 2026, DOE published a request for information asking how the 2029 standards interact with the April 2026 defense determination, including reliance on amorphous steel and domestic grain-oriented electrical steel capacity; comments closed July 15, 2026 (91 FR 35903). The compliance date has not changed. It is 29 months away from this report's update.
Presidential Determination 2026-10 of April 20, 2026 found that limited domestic production capacity, extended procurement timelines and foreign supply dependence prevent timely supply of grid equipment, and named transformers and electrical core steel. It follows Presidential Determination 2022-19 of June 6, 2022. CRS reported in April 2026 that it found no evidence DPA funds had been allocated to transformers.
Section 232 coverage has changed three times. The August 2025 inclusions notice (90 FR 40326) added HTSUS 8504.23.00 and the core and lamination lines 8504.90.9634, 8504.90.9638 and 8504.90.9642 to the steel derivative list from August 18, 2025, with duty on the steel content only; 8504.21 and 8504.22 were not on it. Proclamation 11021 (signed April 2, 2026; 91 FR 18201), effective April 6, 2026, applies the duty to the full customs value and puts 8504.21.00, 8504.22.00 and the three core lines in Annex I-B at 25%, and 8504.23.00 in Annex III, where the general duty plus the Section 232 duty totals 15% until December 31, 2027; the 25% rate applies from January 1, 2028. Proclamation 11032 (91 FR 34085), effective June 8, 2026, kept these placements.
- HTSUS 8504.21.00 (up to 650 kVA) and 8504.22.00 (650 to 10,000 kVA): heading 9903.82.09, general rate Free plus 25% on full value (HTSUS 2026 Revision 22).
- HTSUS 8504.23.00 (over 10,000 kVA): heading 9903.82.10, 15% total, which is the 1.6% general rate plus 13.4 percentage points, until December 31, 2027.
- Laminations, stacked cores and wound cores (8504.90.9634, 8504.90.9638, 8504.90.9642): 25% (Annex I-B).
- Exceptions in the schedule: 15% for qualifying UK products on the 25% list, 10% where at least 85% of the steel was melted and poured in the US, and no Section 232 duty outside chapters 72 to 76 when steel is less than 15% of the article's weight.
- No separate Section 232 investigation of transformers, electrical steel or grid equipment appears among the 13 Commerce investigation notices of 2025 and 2026; the October 2026 wind turbine proclamation changed no tariffs (91 FR 68001).
- Unchanged: the antidumping order on large power transformers from South Korea, in place since 2012, continued in 2024; the all-others cash deposit rate is 22.00%. CRS describes a 50% tariff on steel articles including electrical steel.
What the transformer shortage means for a new service, a panel upgrade or a commercial job
Published utility records show the shortage reaching customers mainly as readiness rules and allocation, not as a single national wait time. Contractors should expect the utility side of a new or upgraded service to depend on transformer availability in that territory.
SMUD's January 2025 board exhibit is the most specific public record we found. SMUD raised safety stock, introduced electrical readiness criteria and, for subdivisions, issued two transformers to each developer once the site was ready. Commercial projects had to have the panel and conductor on site, and buildings had to have foundation and framing complete. SMUD said it was meeting its 60-day service level agreement, with line construction at 40 days.
Earlier evidence came from public power. In APPA's 2022 survey, one in five public power projects was deferred or canceled for lack of distribution transformers, and 30% of respondents were at high risk of stocking out of at least one voltage class within a month (APPA). Commenters in DOE's 2024 rule, including home builder and multifamily groups, said shortages were delaying housing developments and limiting utilities' ability to connect new customers.
Prices reach the bid as well. In April 2025, Chelan County PUD in Washington reported that 21 of 28 line items in its 2025 to 2026 distribution transformer bid exceeded the engineer's estimate by more than 15% (Chelan PUD board agenda).
- Residential service upgrade: a larger service, such as one driven by an EV charger or heat pump, may need a larger utility transformer. Panel and service costs are covered in our electrical panel upgrade cost report and EV charger installation cost report.
- New residential subdivision: allocation and readiness rules like SMUD's tie transformer release to completed site work.
- Commercial and industrial job: three-phase pad-mount units and customer-owned transformers sit in the classes where public lead-time figures stayed longest.
For business context on the contractor side, see our business section. Work on utility equipment and service conductors is for the utility and licensed electricians; this report gives no installation guidance.
How the benchmark is built
Price change, power and distribution transformer PPI
Formula(WPU117409 Jul 2026 / Jan 2020 - 1) x 100
Inputs: fact rows for WPU117409 Jan 2020 and Jul 2026 (fact sheet rows)
Result: 91.4% (Jan 2020 to Jul 2026); 71.2% of the index-point rise happened by Jan 2023
Prices nearly doubled, and most of the increase was locked in by early 2023; later increases are smaller but continuing (8.7% in the 12 months to July 2026).
Limitations: July 2026 is preliminary; BLS published no August or September 2026 value for WPU117409 at access. Nominal index, not inflation-adjusted.
Import value and units by HS code, 2019 vs 2025
Formula(2025 / 2019 - 1) x 100 for value and units, per HS code and combined
Inputs: UN Comtrade rows for 2019 and 2025, HS 850421, 850422, 850423 (fact sheet rows)
Result: Combined value up 394.1% (4.9 times); units up 69.8% (8504.21), 476.4% (8504.22) and 316.3% (8504.23); at customs value the combined rise was 390.2%
Imports filled much of the gap, and for the larger classes the growth is in units, not only price.
Limitations: CIF value; units noisy; nominal dollars; HS codes cover liquid-dielectric units only and are not a perfect match for the distribution and power classes. CIF ran 2.3% above customs value in 2025, so the basis changes the level more than the trend.
Source-country concentration
Formulapartner value / total value x 100
Inputs: UN Comtrade partner rows, 2019 and 2025 (fact sheet rows)
Result: Top five supplied 70.9% in 2025; Mexico's share fell from 40.7% to 28.2% while South Korea rose from 9.5% to 21.5%
Supply diversified across more countries, but five countries still supply most of the value.
Limitations: Value shares; unit shares differ because the countries ship different sizes.
Lead-time multiple across dated records
Formulalater midpoint / earlier midpoint, months x 4.345 to weeks
Inputs: lead-time fact rows (SMUD, Rhode Island Energy, APPA, DOE, Wood Mackenzie) (fact sheet rows)
Result: 2.4 to 4.8 times
Every independent record shows lead times at least doubling; the largest multiples are for distribution units in public power and DOE's statement.
Limitations: Records cover different classes, utilities and years; midpoints hide ranges; 'more than 52 weeks' treated as 52.
Import share cross-check
Formula(2025 units 8504.21 + 8504.22) / 1.5 million x 100
Inputs: UN Comtrade 2025 units; DOE 2021 shipments via CRS (fact sheet rows)
Result: 26.5%
Consistent with CRS's 25% to 30% import share for finished distribution transformers.
Limitations: Different years and scopes; not a measured share.
NREL stock and demand projection
Formulaas published
Inputs: NREL November 2024 fact rows (fact sheet rows)
Result: 60 to 80 million units in service; 1.5 to 2.4 million added or replaced a year; 2050 capacity at 160% to 260% of 2021
Replacement alone sustains demand near or above 2021 shipment levels before any new load.
Limitations: NREL's February 2024 paper words the same range as an increase on 2021 levels, which CRS reads as more than tripling; we report the November 2024 wording.
DOE efficiency rule compliance timing
Formulamonths from Nov 2026 to Apr 2029
Inputs: 89 FR 29834 compliance date; 91 FR 35903 RFI (fact sheet rows)
Result: 29 months; $228.8 million one-time conversion cost (DOE estimate)
Manufacturers face a redesign deadline while DOE reviews the rule; any change would need a new rulemaking.
Limitations: DOE cost estimates are model outputs from the 2024 rule.
CIF versus customs value cross-check
Formula(CIF total / customs-value total - 1) x 100; customs value = UN Comtrade fobvalue for US imports
Inputs: fact rows 234 to 247, 233 (fact sheet rows)
Result: 2.3% in 2025; customs value $7,499.7 million
Freight and insurance add about 2% to the import bill; growth rates barely change (394.1% CIF, 390.2% customs value).
Limitations: Census figures were not downloaded directly because the Census trade API needs a key; the UN figures are reported by the US but can be revised later.
Where contractors differ
- The BLS power and distribution transformer index (WPU117409) was 381.8 in July 2026 (preliminary), 91.4% above January 2020, United States.[1]
- The transformer manufacturing industry index (PCU335311335311) was 475.1 in September 2026, 85.9% above January 2020 and 7.8% above September 2025.[2]
- WPU117409 rose 65.1% from January 2020 to January 2023 and 15.9% from January 2023 to July 2026.[1]
- US imports under HS 8504.21 to 8504.23 were $7,672.0 million in 2025 (CIF), up 394.1% from 2019; at customs value they were $7,499.7 million, up 390.2%.[5][38]
- Imported units over 10,000 kVA rose from 1,206 in 2019 to 5,021 in 2025; mid-size units rose from 8,242 to 47,509.[5]
- Mexico's share of 2025 import value was 28.2%, down from 40.7% in 2019; South Korea's rose from 9.5% to 21.5%.[5]
- January to August 2026 imports were $5,235.2 million, 2.5% above the same months of 2025.[6]
- SMUD reported distribution transformer lead times of more than 52 weeks in 2024 to 2025, against 16 to 20 weeks before 2020 (January 2025).[23]
- Rhode Island Energy reported substation transformer lead times rising from 32 to 44 weeks to 104 to 156 weeks (February 2024).[24]
- APPA reported public power distribution transformer lead times rising from about 2 to 3 months before 2021 to about 12 months in 2022, up 429%.[27]
- NIAC's final June 2024 report, approved by Council vote on June 11, 2024, put domestic production at about 20% of US large power transformer demand.[16][35]
- DOE estimates 85% of liquid-immersed distribution transformer manufacturing takes place in the US (April 2024).[7]
- NREL estimates 60 to 80 million distribution transformers in service and 1.5 to 2.4 million added or replaced each year (November 2024).[15]
- DOE's amended efficiency standards require compliance from April 23, 2029, with estimated savings of 4.58 quads.[7]
- From April 6, 2026, Section 232 duties apply to the full customs value of US imports of HTSUS 8504.21.00 and 8504.22.00 at 25%; 8504.23.00 pays a 15% total duty until December 31, 2027 and 25% from January 1, 2028 (Proclamation 11021).[36][37]
In short
- Prices: the BLS index for power and distribution transformers rose 91.4% from January 2020 to July 2026 and was still up 8.7% year on year.
- Most of the increase came early: 71.2% of the index-point rise had happened by January 2023.
- Imports: US imports of liquid-filled transformers grew from $1,552.7 million in 2019 to $7,672.0 million in 2025 (CIF; $7,499.7 million at customs value), then flattened, up 2.5% in January to August 2026.
- Sources: Mexico (28.2%) and South Korea (21.5%) led 2025 import value; the top five countries supplied 70.9%.
- Lead times: dated utility and federal records show waits rising 2.4 to 4.8 times from pre-2021 norms; large power transformers still take 2 to 4 years.
- Demand: NREL estimates 60 to 80 million distribution transformers in service, about half older than 33 years, with 1.5 to 2.4 million added or replaced a year.
- Policy: since April 6, 2026, Section 232 duties apply to the full value of liquid-filled transformer imports, 25% for HTSUS 8504.21 and 8504.22 and a 15% total duty for 8504.23 until December 31, 2027. DOE's efficiency standard applies from April 23, 2029 and is under review.
What people search for
How long are transformer lead times?
Published figures for distribution transformers rose from about 2 to 3 months before 2021 (APPA) to about 12 months in 2022 and 1 to 2 years or longer in 2024 (DOE). A consultancy estimate cited by CRS put the average at 30 weeks in the second quarter of 2025. Large power transformers still take 2 to 4 years (NIAC, June 2024; DOE, March 2026).
Why is there a transformer shortage?
Federal reports cite aging stock (about 50% to 55% of distribution units older than 33 years, NREL), post-pandemic demand, new load from data centers, EV charging and renewables, limited domestic capacity for large units (about 20% of demand, NIAC) and a single domestic producer of grain-oriented electrical steel (DOE).
Is the transformer shortage over?
Not fully. Distribution lead times have come down from their 2023 and 2024 peaks, and January to August 2026 imports were only 2.5% above 2025. But the federal price index was still rising 8.7% a year in July 2026, and the April 2026 Presidential Determination found extended procurement timelines for grid equipment.
How does a transformer shortage affect new construction?
It shows up as utility readiness rules, allocation and deferrals. SMUD issued two transformers per subdivision developer once a site was ready (January 2025), and APPA members deferred or canceled one in five projects in 2022. Commenters in DOE's 2024 rule said shortages delayed housing developments.
Common questions
How much have transformer prices increased since 2020?
The BLS index for power and distribution transformers rose 91.4% from January 2020 to July 2026 (preliminary). The transformer manufacturing industry index rose 85.9% from January 2020 to September 2026.
Are transformer prices still rising in 2026?
Yes. The power and distribution transformer index rose 8.7% in the 12 months to July 2026, and the industry index rose 7.8% in the 12 months to September 2026.
How much does the US spend on imported transformers?
US imports of liquid-filled transformers under HS 8504.21 to 8504.23 were $7,672.0 million in 2025 on a CIF basis and $7,499.7 million at customs value, up from $1,552.7 million (CIF) in 2019.
Where do US transformers come from?
In 2025, Mexico supplied 28.2% of liquid-filled transformer import value, South Korea 21.5%, Brazil 8.8%, Canada 6.4% and Austria 5.9%. DOE estimates 85% of liquid-immersed distribution transformer manufacturing is done in the US.
What share of large power transformers is made in the US?
NIAC's final June 2024 report estimated domestic production met about 20% of large power transformer demand in 2024 and set a goal of 50% by 2029. DOE found 82% of large power transformers used in the US in 2019 were imported.
How many distribution transformers are there in the US?
NREL estimates 60 to 80 million distribution transformers in service, with 1.5 to 2.4 million added or replaced each year (November 2024).
When does the new DOE distribution transformer efficiency standard take effect?
Compliance is required for units manufactured or imported on or after April 23, 2029. DOE opened a request for information on the rule in June 2026; the date has not changed.
Did the federal government invoke the Defense Production Act for transformers?
Yes, twice: Presidential Determination 2022-19 (June 6, 2022) and 2026-10 (April 20, 2026). CRS reported in April 2026 that it found no evidence DPA funds had been allocated to transformers.
Are imported transformers subject to steel tariffs?
Yes. Since April 6, 2026, Section 232 duties apply to the full customs value: 25% for HTSUS 8504.21.00 and 8504.22.00 and a 15% total duty for 8504.23.00 (over 10,000 kVA) until December 31, 2027, rising to 25% from January 1, 2028 (Proclamation 11021, 91 FR 18201; HTSUS 2026 Revision 22).
Why do large power transformers take years to deliver?
They are custom-built, rely on imported electrical steel and long-lead parts such as bushings, and need factory test beds. DOE's 2022 review found six US producers making 122 to 153 large power transformers a year from 2015 to 2019.
Get the data
Every table in this report is available as a CSV under CC BY 4.0. The fact sheet lists each value with its source URL and access date.
- derived_metrics.csv (CSV)
- fact_sheet.csv (CSV)
- Transformer producer price indexes: change since January 2020 (CSV)
- Transformer producer price indexes, annual averages, 2018 to 2025 (CSV)
- Every dated public transformer lead-time figure found (CSV)
- US imports by HS code, 2019 vs 2025 (CSV)
- Top source countries for US liquid-filled transformer imports, 2019 vs 2025 (CSV)
- US imports of liquid-filled transformers by HS code and year, US$ millions (CSV)
- Federal actions on transformer supply, 2012 to 2026 (CSV)
- Domestic capacity and demand benchmarks from federal reports (CSV)
Cite this report
The figures to cite first
- Transformer PPI up 91.4%, January 2020 to July 2026 (BLS WPU117409).[1]
- US transformer imports $7,672.0 million in 2025 vs $1,552.7 million in 2019 (UN Comtrade, HS 8504.21 to 8504.23).[5]
- Distribution transformer lead times: 3 to 6 months in 2019, 1 to 2 years or longer in 2024 (DOE, March 2026).[21]
- Section 232: 25% on HTSUS 8504.21 and 8504.22, 15% total on 8504.23 until 2027-12-31 (Proclamation 11021, 91 FR 18201).[36][37]
Quotable figures
- The US producer price index for power and distribution transformers rose 91.4% from January 2020 to July 2026 (BLS, preliminary).[1]
- US imports of liquid-filled transformers (HS 8504.21 to 8504.23) reached $7,672.0 million in 2025, 4.9 times the 2019 level (UN Comtrade, US-reported data).[5]
- Mexico supplied 28.2% and South Korea 21.5% of US liquid-filled transformer import value in 2025 (UN Comtrade).[5]
- SMUD reported distribution transformer lead times of more than 52 weeks in 2024 to 2025, against 16 to 20 weeks before 2020 (SMUD board exhibit, January 2025).[23]
- Rhode Island Energy told regulators substation transformer lead times rose from 32 to 44 weeks to 104 to 156 weeks (RIPUC filing, February 2024).[24]
- NREL estimates 60 to 80 million distribution transformers are in service in the US, about half older than 33 years (November 2024).[15]
- DOE's amended distribution transformer efficiency standard requires compliance from April 23, 2029; DOE opened a review in June 2026.[7][8]
- Since April 6, 2026, imported liquid-filled transformers up to 10,000 kVA (HTSUS 8504.21 and 8504.22) pay a 25% Section 232 duty on full value (Proclamation 11021).[36]
Summary for editors
US transformer prices have nearly doubled since the start of 2020, according to a new Electrical Contractors and Wiring Data Desk analysis of federal data. The Bureau of Labor Statistics index for power and distribution transformers was 91.4% above January 2020 in July 2026 and still 8.7% higher than a year earlier. US imports of liquid-filled transformers reached $7,672.0 million in 2025 (CIF; $7,499.7 million at customs value), 4.9 times the 2019 level, led by Mexico and South Korea, and were nearly flat in the first eight months of 2026. Since April 6, 2026, Section 232 duties apply to the full value of these imports: 25% for units up to 10,000 kVA and 15% in total for larger units until the end of 2027. Public lead-time records show waits rising 2.4 to 4.8 times from pre-2021 norms; large power transformers still take 2 to 4 years. Data are free to reuse under CC BY 4.0.
Headlines the data supports
- Transformer prices up 91.4% since 2020 as shortage eases only for small units
- US transformer imports hit $7.7 billion in 2025, 4.9 times 2019
- Utility filings show transformer lead times rose up to 4.8 times before easing
- Mexico and South Korea supply half of US transformer imports by value
- DOE reviews 2029 transformer efficiency rule as Defense Production Act names transformers
Citation
Electrical Contractors and Wiring. (2026). Transformer Shortage: Prices, Lead Times, Imports and Policy in Federal Data, 2019 to 2026. Retrieved from https://electricalcontractorsandwiring.com/data/transformer-shortage/
Reuse
Data and tables are licensed CC BY 4.0. Attribution: “Source: Electrical Contractors and Wiring, Transformer Shortage: Prices, Lead Times, Imports and Policy in Federal Data, 2019 to 2026” with a link to this page.
How we built this report
Selection: we used the most recent release of each public dataset at access on 2026-11-05. Prices come from BLS PPI flat files (September 2026 release of 2026-10-15; WPU117409 still had no August or September 2026 value when rechecked on 2026-11-05). Trade data come from the UN Comtrade public API with the United States as reporter, which republishes U.S. Census Bureau import statistics; the Census International Trade API redirected a keyless request to its missing-key page on 2026-11-03 and USA Trade Online needs a login, so Census tables were not downloaded directly. Customs values use Comtrade's FOB field, which the UN country note for the United States equates with Census customs value. Documents were included only if opened in full and saved in raw/.
Inclusion and exclusion: a lead-time figure entered the record only if it carried a date and a named source we could open. Federal, regulator and public-utility documents are Tier 1; trade associations Tier 2; consultancies and trade press Tier 3. Stakeholder comments summarized in the DOE rule are labelled as commenter claims. Paid research is cited only through its public summaries and never as a headline figure. Pages that blocked automated access were retrieved through the Internet Archive or logged in excluded.md.
Conflicts: Wood Mackenzie's own 2025 summary gives a 6% distribution transformer deficit and 116% power transformer demand growth since 2019, while press reports of the same work give 10% and 119%; we cite the firm's page and flag the difference. NREL's February 2024 paper says capacity needed by 2050 is a 160% to 260% increase on 2021, while its November 2024 fact sheet says 160% to 260% of 2021 levels; we use the later wording. NREL's November 2024 sheet gives both ~55% and ~50% for units older than 33 years; we report about 50% to 55%. CRS's 25% to 30% import share for distribution units and Wood Mackenzie's 50% differ in date and scope; we report the CRS figure in the main text. The NIAC report is cited in its final June 2024 version, approved by Council vote on June 11, 2024 (minutes on cisa.gov); every NIAC figure used here (2 to 4 years, 80%, 20%, 50% by 2029, 25% amorphous) is identical in the June 5, 2024 draft cited in the first edition.
Derived metrics: percent changes are (later / earlier – 1) x 100 on unrounded index values. Import totals sum the three HS codes on a CIF basis for the 2018 to 2025 series because UN Comtrade carries no FOB value for 2018, 2020 and 2021; customs-value totals are given for 2019, 2023 to 2025 and January to August of 2025 and 2026. Lead-time multiples use range midpoints, convert months to weeks at 4.345 weeks per month, and treat 'more than 52 weeks' as 52. Every formula and input row is in derived_metrics.csv and scripts/.
Section 232 coverage: we read the August 2025 inclusions notice (90 FR 40326), Proclamations 11021 (91 FR 18201) and 11032 (91 FR 34085), whose annexes are images in the Federal Register PDF and were read by OCR, and checked the result against U.S. note 16 and headings 9903.82.02 to 9903.82.26 of HTSUS 2026 Revision 22 (USITC). We searched Federal Register notices from Commerce's Bureau of Industry and Security for 2025 and 2026 for a separate transformer, electrical steel or grid equipment investigation and found none. Tariff treatment of a specific entry depends on classification, origin and metal content; this is not trade-compliance advice.
Limitations: PPI values for the latest four months are preliminary. Import values are nominal and include freight and insurance. HS 8504.21 to 8504.23 cover liquid-dielectric transformers only, so dry-type units are excluded and the size classes do not map exactly onto distribution and power transformers. Unit counts in trade data are noisy. Lead-time records come from different utilities, classes and years and are not a national time series. No public national inventory of transformers exists; stock figures are modeled.
Last update: 2026-11-05 (first edition 2026-11-02). We check the PPI monthly after each BLS release and trade data quarterly.
This report presents published data with its limitations. It is not legal, financial or investment advice.
Sources by tier
Tier 1: primary and official sources (32)
- [1] U.S. Bureau of Labor Statistics. PPI commodity data, machinery and equipment (wp.data.12c.Machinery117-119): WPU117409, WPU1174, WPU117411. Dec 1999 to Sep 2026 (WPU117409 to Jul 2026). Accessed 2026-11-05.
- [2] U.S. Bureau of Labor Statistics. PPI industry data, electrical equipment (pc.data.21.ElectricalMachinery): PCU335311335311. 1967 to Sep 2026. Accessed 2026-11-05.
- [3] U.S. Bureau of Labor Statistics. Producer Price Indexes, September 2026 (USDL 26-1576). released 2026-10-15. Accessed 2026-11-02.
- [4] U.S. Bureau of Labor Statistics. Schedule of Releases for the Producer Price Index. Oct 2026 to Oct 2027 releases. Accessed 2026-11-02.
- [5] United Nations Statistics Division, data reported by the U.S. Census Bureau. UN Comtrade public API: US imports by partner, HS 850421, 850422, 850423, annual (example query for 2025, HS 850423). 2018 to 2025. Accessed 2026-11-05.
- [6] United Nations Statistics Division, data reported by the U.S. Census Bureau. UN Comtrade public API: US monthly imports, HS 850421 to 850423 (example query for Aug 2026). Jan 2025 to Aug 2026. Accessed 2026-11-05.
- [7] U.S. Department of Energy. Energy Conservation Program: Energy Conservation Standards for Distribution Transformers, final rule (89 FR 29834). published 2024-04-22. Accessed 2026-11-02.
- [8] U.S. Department of Energy. Energy Conservation Standards for Distribution Transformers, request for information (91 FR 35903). published 2026-06-15. Accessed 2026-11-02.
- [9] Executive Office of the President. Presidential Determination No. 2026-10 on Grid Infrastructure, Equipment, and Supply Chain Capacity (91 FR 21931). signed 2026-04-20. Accessed 2026-11-02.
- [10] Executive Office of the President. Presidential Determination No. 2022-19 on Transformers and Electric Power Grid Components (87 FR 35079). signed 2022-06-06. Accessed 2026-11-02.
- [11] U.S. Department of Commerce, Bureau of Industry and Security. Adoption and Procedures of the Section 232 Steel and Aluminum Tariff Inclusions Process (90 FR 40326). effective 2025-08-18. Accessed 2026-11-05.
- [12] U.S. Department of Commerce, International Trade Administration. Large Power Transformers From the Republic of Korea: Continuation of Antidumping Duty Order (89 FR 72373). applicable 2024-08-27. Accessed 2026-11-02.
- [13] U.S. Department of Commerce, International Trade Administration. Large Power Transformers From the Republic of Korea: Preliminary Results of Antidumping Duty Administrative Review; 2024-2025 (91 FR 68940). published 2026-11-02. Accessed 2026-11-02.
- [14] National Renewable Energy Laboratory (now National Laboratory of the Rockies). Major Drivers of Long-Term Distribution Transformer Demand (NREL/TP-6A40-87653). February 2024. Accessed 2026-11-02.
- [15] National Renewable Energy Laboratory (now National Laboratory of the Rockies). Distribution Transformer Demand: Understanding Demand Segmentation, Drivers, and Management Through 2050 (NREL/FS-6A40-92076). November 2024. Accessed 2026-11-02.
- [16] President's National Infrastructure Advisory Council, posted by CISA. Addressing the Critical Shortage of Power Transformers to Ensure Reliability of the U.S. Grid (final report, approved by Council vote June 11, 2024). June 2024. Accessed 2026-11-05.
- [17] U.S. Department of Energy. Electric Grid Supply Chain Review: Large Power Transformers and High Voltage Direct Current Systems. February 2022. Accessed 2026-11-02.
- [18] U.S. Department of Energy, Office of Electricity Delivery and Energy Reliability. Large Power Transformers and the U.S. Electric Grid (April 2014 update). April 2014. Accessed 2026-11-02.
- [19] Congressional Research Service. Electricity Distribution Transformers: Supply, Tariffs, and Policy Options (R48933). April 23, 2026. Accessed 2026-11-02.
- [20] North American Electric Reliability Corporation. 2023 Long-Term Reliability Assessment. December 2023. Accessed 2026-11-02.
- [21] U.S. Department of Energy. Distribution Transformer Convening Webinar, transcript. March 5, 2026. Accessed 2026-11-02.
- [22] U.S. Department of Energy. Distribution Transformer Shortage Mitigation (presentation). November 19, 2024. Accessed 2026-11-02.
- [23] Sacramento Municipal Utility District. Exhibit to Agenda Item 1: New Service Connections timelines, supply chain, and electrical readiness. January 15, 2025. Accessed 2026-11-02.
- [24] The Narragansett Electric Company d/b/a Rhode Island Energy. Rhode Island Energy responses to Division Data Requests, Set 7, RIPUC Docket 23-48-EL (Internet Archive snapshot). February 7, 2024. Accessed 2026-11-02.
- [25] Public Utility District No. 1 of Chelan County. Board agenda, 2025-2026 Distribution Transformer Purchase and Supply, Bid No. 24-13992 (Internet Archive snapshot). April 21, 2025. Accessed 2026-11-02.
- [26] Executive Office of the President. Proclamation 11032, Further Adjusting the Tariff Regimes for Imports of Aluminum, Steel, and Copper Into the United States (91 FR 34085). signed 2026-06-01. Accessed 2026-11-05.
- [35] Cybersecurity and Infrastructure Security Agency (CISA). NIAC Quarterly Business Meeting minutes, June 11, 2024. June 11, 2024. Accessed 2026-11-05.
- [36] Executive Office of the President via Federal Register. Proclamation 11021, Strengthening Actions Taken To Adjust Imports of Aluminum, Steel, and Copper Into the United States (91 FR 18201, FR Doc 2026-06960), with Annexes I-B and III. signed April 2, 2026; effective April 6, 2026. Accessed 2026-11-05.
- [37] U.S. International Trade Commission. Harmonized Tariff Schedule of the United States, 2026 Revision 22, Chapter 99 (U.S. note 16, headings 9903.82.02 to 9903.82.26). in force from October 30, 2026. Accessed 2026-11-05.
- [38] United Nations Statistics Division. International Merchandise Trade Statistics country note: United States (valuation of imports). undated. Accessed 2026-11-05.
- [39] Executive Office of the President via Federal Register. Proclamation 11074, Adjusting Imports of Wind Turbines and Their Parts and Components Into the United States (91 FR 68001, FR Doc 2026-22049). October 22, 2026. Accessed 2026-11-05.
- [40] U.S. International Trade Commission. HTS search API, heading 8504 (general duty rates). 2026 Revision 22. Accessed 2026-11-05.
Tier 2: trade bodies, market research, company data (2)
- [27] American Public Power Association. Public Power Distribution Transformer Demand Survey Summary. survey August 2022, published October 2022. Accessed 2026-11-02.
- [28] American Public Power Association. National Council Publishes Report on Addressing Power Transformer Shortage. September 16, 2024. Accessed 2026-11-02.
Tier 3: journalism and expert commentary (6)
- [29] Wood Mackenzie. Supply shortages and an inflexible market give rise to high power transformer lead times. 2023. Accessed 2026-11-02.
- [30] Wood Mackenzie. Transformer troubles: manufacturing and policy constraints hit US transformer supply. 2025. Accessed 2026-11-02.
- [31] POWER magazine. Transformers in 2026: Shortage, Scramble, or Self-Inflicted Crisis?. 2026. Accessed 2026-11-02.
- [32] pv magazine USA. U.S. transformer market faces severe supply constraints as lead times extend to four years. May 11, 2026. Accessed 2026-11-02.
- [33] T&D World. Report Warns of Worsening Transformer Shortages Amid Rising U.S. Power Demand. 2025. Accessed 2026-11-02.
- [34] pv magazine. US transformer supply may fall sharply in 2025, says Wood Mackenzie. August 15, 2025. Accessed 2026-11-02.